Immigrants from Eritrea vs Bhutanese Married-Couple Family Poverty
COMPARE
Immigrants from Eritrea
Bhutanese
Married-Couple Family Poverty
Married-Couple Family Poverty Comparison
Immigrants from Eritrea
Bhutanese
5.9%
MARRIED-COUPLE FAMILY POVERTY
1.1/ 100
METRIC RATING
250th/ 347
METRIC RANK
4.1%
MARRIED-COUPLE FAMILY POVERTY
99.9/ 100
METRIC RATING
23rd/ 347
METRIC RANK
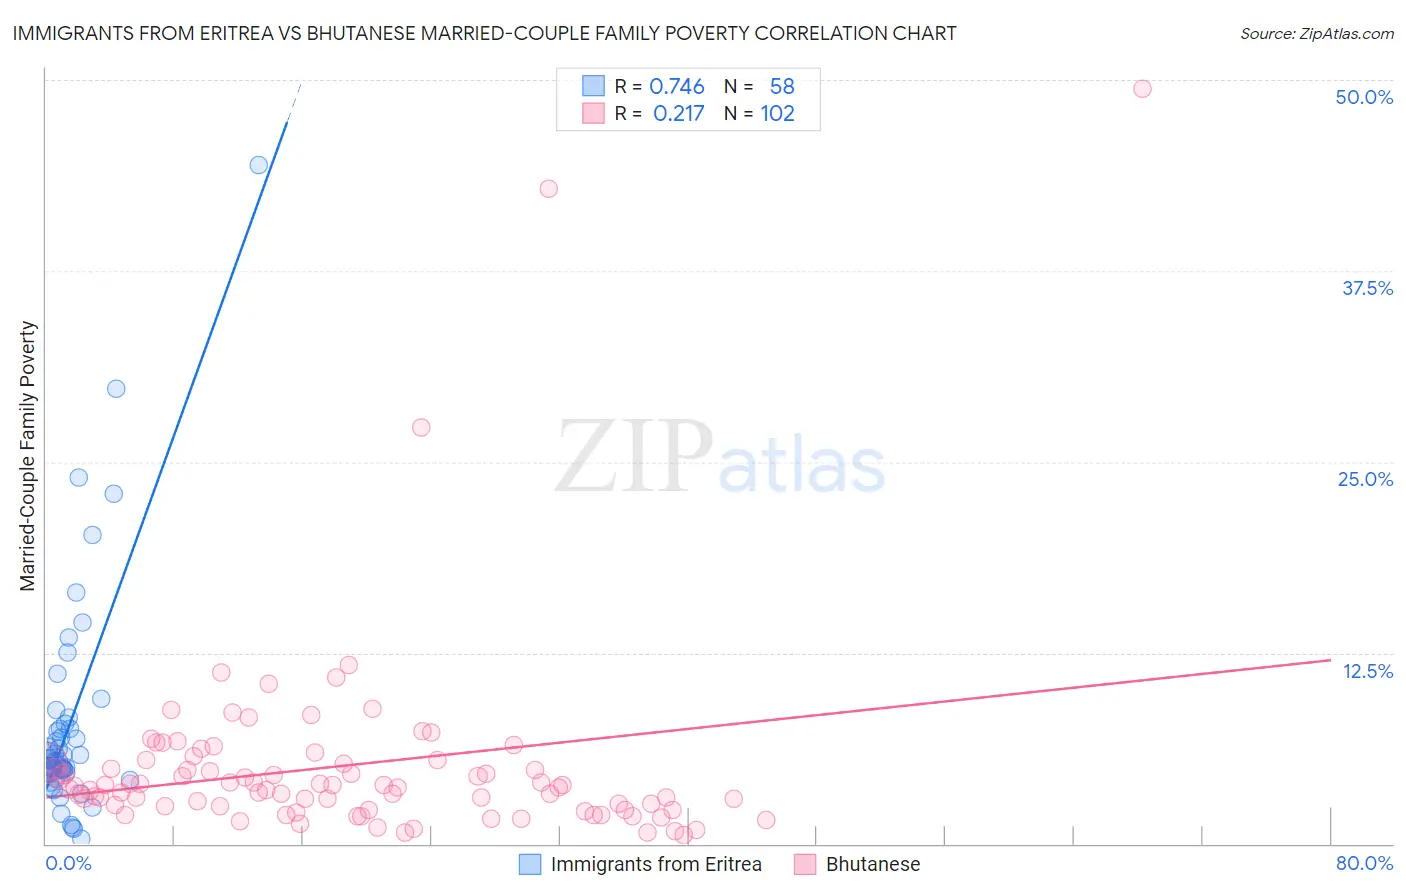
Immigrants from Eritrea vs Bhutanese Married-Couple Family Poverty Correlation Chart
The statistical analysis conducted on geographies consisting of 104,722,236 people shows a strong positive correlation between the proportion of Immigrants from Eritrea and poverty level among married-couple families in the United States with a correlation coefficient (R) of 0.746 and weighted average of 5.9%. Similarly, the statistical analysis conducted on geographies consisting of 450,291,687 people shows a weak positive correlation between the proportion of Bhutanese and poverty level among married-couple families in the United States with a correlation coefficient (R) of 0.217 and weighted average of 4.1%, a difference of 44.2%.
Married-Couple Family Poverty Correlation Summary
| Measurement | Immigrants from Eritrea | Bhutanese |
| Minimum | 0.29% | 0.54% |
| Maximum | 44.4% | 49.5% |
| Range | 44.2% | 48.9% |
| Mean | 7.8% | 5.1% |
| Median | 5.4% | 3.7% |
| Interquartile 25% (IQ1) | 4.7% | 2.4% |
| Interquartile 75% (IQ3) | 7.5% | 5.4% |
| Interquartile Range (IQR) | 2.8% | 3.0% |
| Standard Deviation (Sample) | 7.5% | 6.7% |
| Standard Deviation (Population) | 7.4% | 6.7% |
Similar Demographics by Married-Couple Family Poverty
Demographics Similar to Immigrants from Eritrea by Married-Couple Family Poverty
In terms of married-couple family poverty, the demographic groups most similar to Immigrants from Eritrea are Tsimshian (5.9%, a difference of 0.21%), Immigrants from Ghana (5.9%, a difference of 0.25%), Cree (5.9%, a difference of 0.31%), Iraqi (5.9%, a difference of 0.74%), and Immigrants from Western Asia (6.0%, a difference of 0.89%).
| Demographics | Rating | Rank | Married-Couple Family Poverty |
| Somalis | 2.3 /100 | #243 | Tragic 5.8% |
| Chickasaw | 2.3 /100 | #244 | Tragic 5.8% |
| Immigrants | Afghanistan | 2.1 /100 | #245 | Tragic 5.8% |
| Immigrants | Venezuela | 1.8 /100 | #246 | Tragic 5.8% |
| Iraqis | 1.4 /100 | #247 | Tragic 5.9% |
| Cree | 1.2 /100 | #248 | Tragic 5.9% |
| Tsimshian | 1.1 /100 | #249 | Tragic 5.9% |
| Immigrants | Eritrea | 1.1 /100 | #250 | Tragic 5.9% |
| Immigrants | Ghana | 1.0 /100 | #251 | Tragic 5.9% |
| Immigrants | Western Asia | 0.7 /100 | #252 | Tragic 6.0% |
| Africans | 0.7 /100 | #253 | Tragic 6.0% |
| Immigrants | Somalia | 0.7 /100 | #254 | Tragic 6.0% |
| Comanche | 0.7 /100 | #255 | Tragic 6.0% |
| Bangladeshis | 0.5 /100 | #256 | Tragic 6.0% |
| Immigrants | Burma/Myanmar | 0.5 /100 | #257 | Tragic 6.0% |
Demographics Similar to Bhutanese by Married-Couple Family Poverty
In terms of married-couple family poverty, the demographic groups most similar to Bhutanese are Immigrants from Singapore (4.1%, a difference of 0.020%), Eastern European (4.1%, a difference of 0.23%), Zimbabwean (4.1%, a difference of 0.39%), Maltese (4.1%, a difference of 0.42%), and Immigrants from Ireland (4.1%, a difference of 0.66%).
| Demographics | Rating | Rank | Married-Couple Family Poverty |
| Germans | 100.0 /100 | #16 | Exceptional 4.0% |
| Filipinos | 100.0 /100 | #17 | Exceptional 4.0% |
| Italians | 100.0 /100 | #18 | Exceptional 4.0% |
| Immigrants | Ireland | 99.9 /100 | #19 | Exceptional 4.1% |
| Maltese | 99.9 /100 | #20 | Exceptional 4.1% |
| Zimbabweans | 99.9 /100 | #21 | Exceptional 4.1% |
| Immigrants | Singapore | 99.9 /100 | #22 | Exceptional 4.1% |
| Bhutanese | 99.9 /100 | #23 | Exceptional 4.1% |
| Eastern Europeans | 99.9 /100 | #24 | Exceptional 4.1% |
| Immigrants | Taiwan | 99.9 /100 | #25 | Exceptional 4.1% |
| Cypriots | 99.9 /100 | #26 | Exceptional 4.1% |
| Danes | 99.9 /100 | #27 | Exceptional 4.1% |
| Scandinavians | 99.9 /100 | #28 | Exceptional 4.1% |
| Immigrants | Scotland | 99.9 /100 | #29 | Exceptional 4.2% |
| Finns | 99.9 /100 | #30 | Exceptional 4.2% |