Immigrants from Eritrea vs Bolivian Married-Couple Family Poverty
COMPARE
Immigrants from Eritrea
Bolivian
Married-Couple Family Poverty
Married-Couple Family Poverty Comparison
Immigrants from Eritrea
Bolivians
5.9%
MARRIED-COUPLE FAMILY POVERTY
1.1/ 100
METRIC RATING
250th/ 347
METRIC RANK
4.6%
MARRIED-COUPLE FAMILY POVERTY
98.6/ 100
METRIC RATING
88th/ 347
METRIC RANK
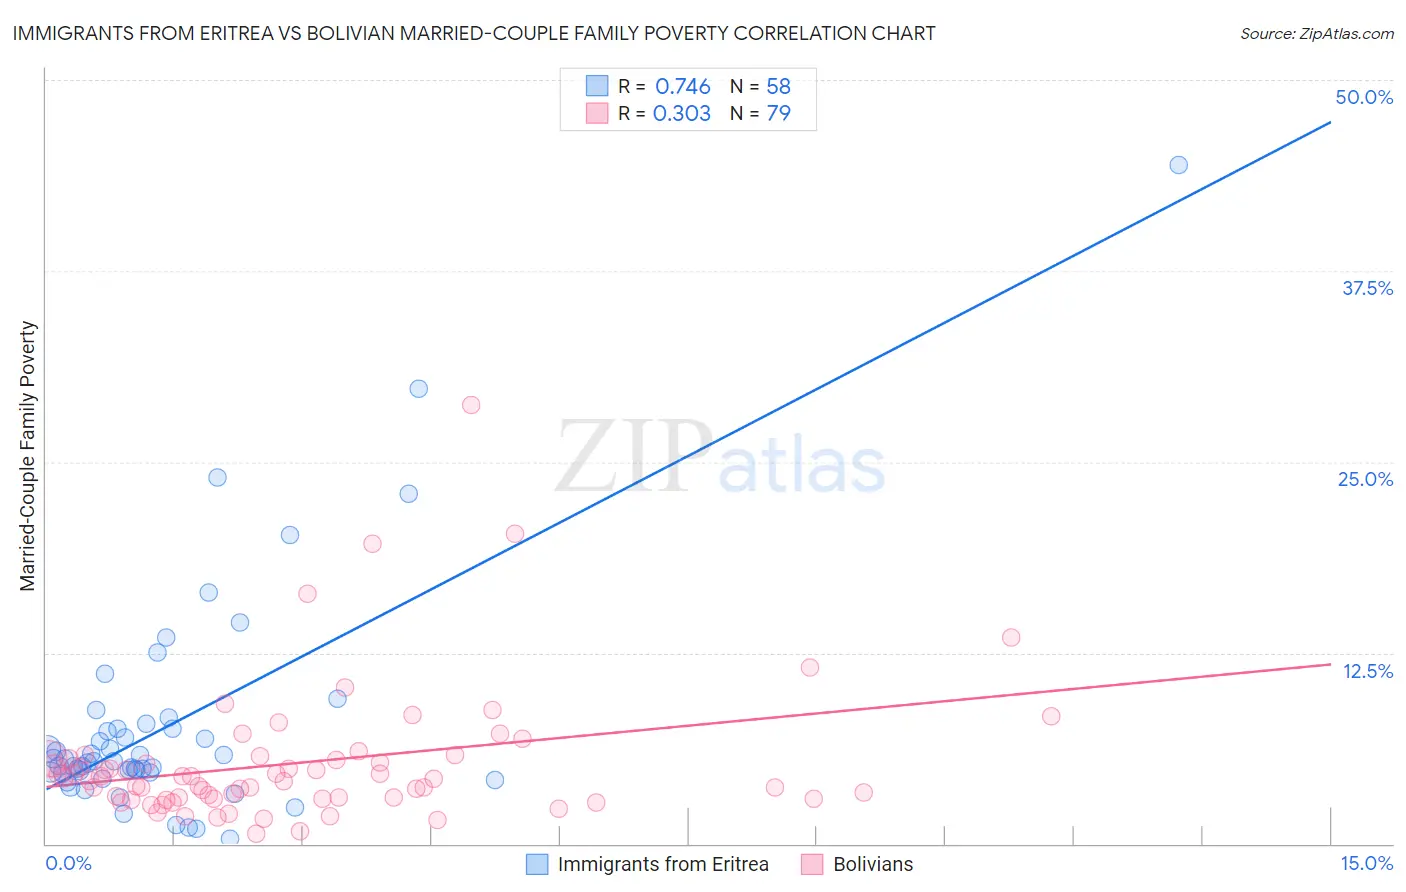
Immigrants from Eritrea vs Bolivian Married-Couple Family Poverty Correlation Chart
The statistical analysis conducted on geographies consisting of 104,722,236 people shows a strong positive correlation between the proportion of Immigrants from Eritrea and poverty level among married-couple families in the United States with a correlation coefficient (R) of 0.746 and weighted average of 5.9%. Similarly, the statistical analysis conducted on geographies consisting of 183,808,216 people shows a mild positive correlation between the proportion of Bolivians and poverty level among married-couple families in the United States with a correlation coefficient (R) of 0.303 and weighted average of 4.6%, a difference of 29.0%.
Married-Couple Family Poverty Correlation Summary
| Measurement | Immigrants from Eritrea | Bolivian |
| Minimum | 0.29% | 0.69% |
| Maximum | 44.4% | 28.7% |
| Range | 44.2% | 28.0% |
| Mean | 7.8% | 5.3% |
| Median | 5.4% | 4.2% |
| Interquartile 25% (IQ1) | 4.7% | 3.0% |
| Interquartile 75% (IQ3) | 7.5% | 5.6% |
| Interquartile Range (IQR) | 2.8% | 2.6% |
| Standard Deviation (Sample) | 7.5% | 4.5% |
| Standard Deviation (Population) | 7.4% | 4.5% |
Similar Demographics by Married-Couple Family Poverty
Demographics Similar to Immigrants from Eritrea by Married-Couple Family Poverty
In terms of married-couple family poverty, the demographic groups most similar to Immigrants from Eritrea are Tsimshian (5.9%, a difference of 0.21%), Immigrants from Ghana (5.9%, a difference of 0.25%), Cree (5.9%, a difference of 0.31%), Iraqi (5.9%, a difference of 0.74%), and Immigrants from Western Asia (6.0%, a difference of 0.89%).
| Demographics | Rating | Rank | Married-Couple Family Poverty |
| Somalis | 2.3 /100 | #243 | Tragic 5.8% |
| Chickasaw | 2.3 /100 | #244 | Tragic 5.8% |
| Immigrants | Afghanistan | 2.1 /100 | #245 | Tragic 5.8% |
| Immigrants | Venezuela | 1.8 /100 | #246 | Tragic 5.8% |
| Iraqis | 1.4 /100 | #247 | Tragic 5.9% |
| Cree | 1.2 /100 | #248 | Tragic 5.9% |
| Tsimshian | 1.1 /100 | #249 | Tragic 5.9% |
| Immigrants | Eritrea | 1.1 /100 | #250 | Tragic 5.9% |
| Immigrants | Ghana | 1.0 /100 | #251 | Tragic 5.9% |
| Immigrants | Western Asia | 0.7 /100 | #252 | Tragic 6.0% |
| Africans | 0.7 /100 | #253 | Tragic 6.0% |
| Immigrants | Somalia | 0.7 /100 | #254 | Tragic 6.0% |
| Comanche | 0.7 /100 | #255 | Tragic 6.0% |
| Bangladeshis | 0.5 /100 | #256 | Tragic 6.0% |
| Immigrants | Burma/Myanmar | 0.5 /100 | #257 | Tragic 6.0% |
Demographics Similar to Bolivians by Married-Couple Family Poverty
In terms of married-couple family poverty, the demographic groups most similar to Bolivians are Immigrants from North Macedonia (4.6%, a difference of 0.10%), Immigrants from Czechoslovakia (4.6%, a difference of 0.11%), Immigrants from Turkey (4.6%, a difference of 0.18%), Immigrants from Switzerland (4.6%, a difference of 0.18%), and South African (4.6%, a difference of 0.22%).
| Demographics | Rating | Rank | Married-Couple Family Poverty |
| Immigrants | Greece | 98.9 /100 | #81 | Exceptional 4.5% |
| Canadians | 98.8 /100 | #82 | Exceptional 4.5% |
| Immigrants | Denmark | 98.8 /100 | #83 | Exceptional 4.6% |
| Immigrants | Croatia | 98.7 /100 | #84 | Exceptional 4.6% |
| South Africans | 98.7 /100 | #85 | Exceptional 4.6% |
| Immigrants | Turkey | 98.6 /100 | #86 | Exceptional 4.6% |
| Immigrants | North Macedonia | 98.6 /100 | #87 | Exceptional 4.6% |
| Bolivians | 98.6 /100 | #88 | Exceptional 4.6% |
| Immigrants | Czechoslovakia | 98.5 /100 | #89 | Exceptional 4.6% |
| Immigrants | Switzerland | 98.5 /100 | #90 | Exceptional 4.6% |
| Basques | 98.5 /100 | #91 | Exceptional 4.6% |
| Immigrants | Norway | 98.4 /100 | #92 | Exceptional 4.6% |
| Koreans | 98.3 /100 | #93 | Exceptional 4.6% |
| Immigrants | Italy | 98.3 /100 | #94 | Exceptional 4.6% |
| Portuguese | 98.3 /100 | #95 | Exceptional 4.6% |