Immigrants from Eritrea vs Houma Married-Couple Family Poverty
COMPARE
Immigrants from Eritrea
Houma
Married-Couple Family Poverty
Married-Couple Family Poverty Comparison
Immigrants from Eritrea
Houma
5.9%
MARRIED-COUPLE FAMILY POVERTY
1.1/ 100
METRIC RATING
250th/ 347
METRIC RANK
6.4%
MARRIED-COUPLE FAMILY POVERTY
0.0/ 100
METRIC RATING
279th/ 347
METRIC RANK
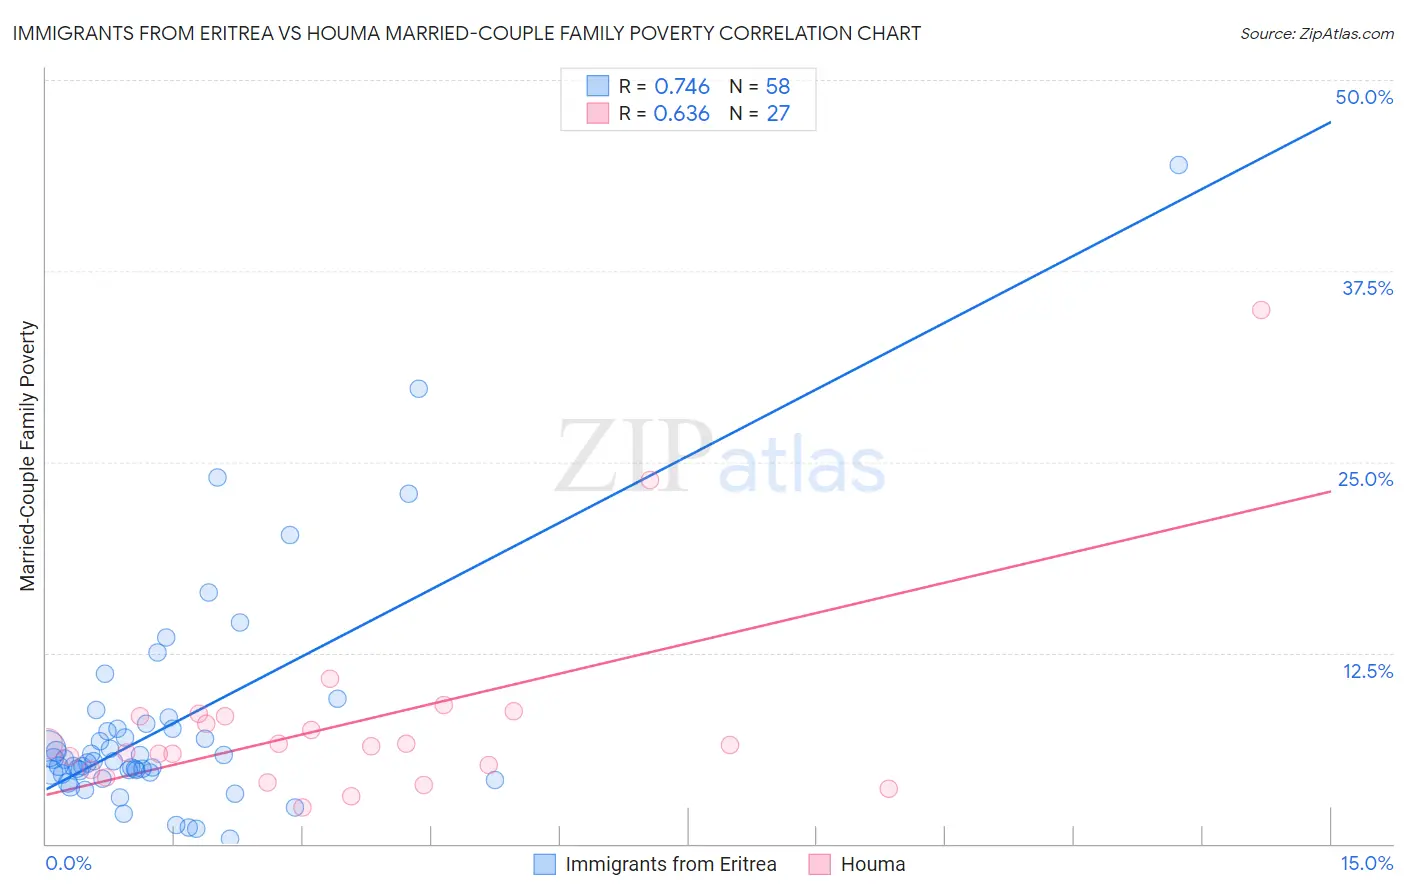
Immigrants from Eritrea vs Houma Married-Couple Family Poverty Correlation Chart
The statistical analysis conducted on geographies consisting of 104,722,236 people shows a strong positive correlation between the proportion of Immigrants from Eritrea and poverty level among married-couple families in the United States with a correlation coefficient (R) of 0.746 and weighted average of 5.9%. Similarly, the statistical analysis conducted on geographies consisting of 36,736,486 people shows a significant positive correlation between the proportion of Houma and poverty level among married-couple families in the United States with a correlation coefficient (R) of 0.636 and weighted average of 6.4%, a difference of 8.0%.
Married-Couple Family Poverty Correlation Summary
| Measurement | Immigrants from Eritrea | Houma |
| Minimum | 0.29% | 2.3% |
| Maximum | 44.4% | 34.9% |
| Range | 44.2% | 32.6% |
| Mean | 7.8% | 8.0% |
| Median | 5.4% | 6.5% |
| Interquartile 25% (IQ1) | 4.7% | 4.8% |
| Interquartile 75% (IQ3) | 7.5% | 8.4% |
| Interquartile Range (IQR) | 2.8% | 3.5% |
| Standard Deviation (Sample) | 7.5% | 6.7% |
| Standard Deviation (Population) | 7.4% | 6.5% |
Similar Demographics by Married-Couple Family Poverty
Demographics Similar to Immigrants from Eritrea by Married-Couple Family Poverty
In terms of married-couple family poverty, the demographic groups most similar to Immigrants from Eritrea are Tsimshian (5.9%, a difference of 0.21%), Immigrants from Ghana (5.9%, a difference of 0.25%), Cree (5.9%, a difference of 0.31%), Iraqi (5.9%, a difference of 0.74%), and Immigrants from Western Asia (6.0%, a difference of 0.89%).
| Demographics | Rating | Rank | Married-Couple Family Poverty |
| Somalis | 2.3 /100 | #243 | Tragic 5.8% |
| Chickasaw | 2.3 /100 | #244 | Tragic 5.8% |
| Immigrants | Afghanistan | 2.1 /100 | #245 | Tragic 5.8% |
| Immigrants | Venezuela | 1.8 /100 | #246 | Tragic 5.8% |
| Iraqis | 1.4 /100 | #247 | Tragic 5.9% |
| Cree | 1.2 /100 | #248 | Tragic 5.9% |
| Tsimshian | 1.1 /100 | #249 | Tragic 5.9% |
| Immigrants | Eritrea | 1.1 /100 | #250 | Tragic 5.9% |
| Immigrants | Ghana | 1.0 /100 | #251 | Tragic 5.9% |
| Immigrants | Western Asia | 0.7 /100 | #252 | Tragic 6.0% |
| Africans | 0.7 /100 | #253 | Tragic 6.0% |
| Immigrants | Somalia | 0.7 /100 | #254 | Tragic 6.0% |
| Comanche | 0.7 /100 | #255 | Tragic 6.0% |
| Bangladeshis | 0.5 /100 | #256 | Tragic 6.0% |
| Immigrants | Burma/Myanmar | 0.5 /100 | #257 | Tragic 6.0% |
Demographics Similar to Houma by Married-Couple Family Poverty
In terms of married-couple family poverty, the demographic groups most similar to Houma are West Indian (6.4%, a difference of 0.050%), Immigrants from Trinidad and Tobago (6.4%, a difference of 0.25%), Mexican American Indian (6.4%, a difference of 0.56%), Seminole (6.4%, a difference of 0.56%), and Indonesian (6.3%, a difference of 0.73%).
| Demographics | Rating | Rank | Married-Couple Family Poverty |
| Trinidadians and Tobagonians | 0.1 /100 | #272 | Tragic 6.2% |
| Colville | 0.1 /100 | #273 | Tragic 6.3% |
| Barbadians | 0.1 /100 | #274 | Tragic 6.3% |
| Choctaw | 0.1 /100 | #275 | Tragic 6.3% |
| Yaqui | 0.1 /100 | #276 | Tragic 6.3% |
| Indonesians | 0.1 /100 | #277 | Tragic 6.3% |
| Immigrants | Trinidad and Tobago | 0.1 /100 | #278 | Tragic 6.4% |
| Houma | 0.0 /100 | #279 | Tragic 6.4% |
| West Indians | 0.0 /100 | #280 | Tragic 6.4% |
| Mexican American Indians | 0.0 /100 | #281 | Tragic 6.4% |
| Seminole | 0.0 /100 | #282 | Tragic 6.4% |
| Ute | 0.0 /100 | #283 | Tragic 6.4% |
| Dutch West Indians | 0.0 /100 | #284 | Tragic 6.4% |
| Blacks/African Americans | 0.0 /100 | #285 | Tragic 6.5% |
| Guyanese | 0.0 /100 | #286 | Tragic 6.5% |