Immigrants from Eritrea vs Bermudan Married-Couple Family Poverty
COMPARE
Immigrants from Eritrea
Bermudan
Married-Couple Family Poverty
Married-Couple Family Poverty Comparison
Immigrants from Eritrea
Bermudans
5.9%
MARRIED-COUPLE FAMILY POVERTY
1.1/ 100
METRIC RATING
250th/ 347
METRIC RANK
5.2%
MARRIED-COUPLE FAMILY POVERTY
52.9/ 100
METRIC RATING
171st/ 347
METRIC RANK
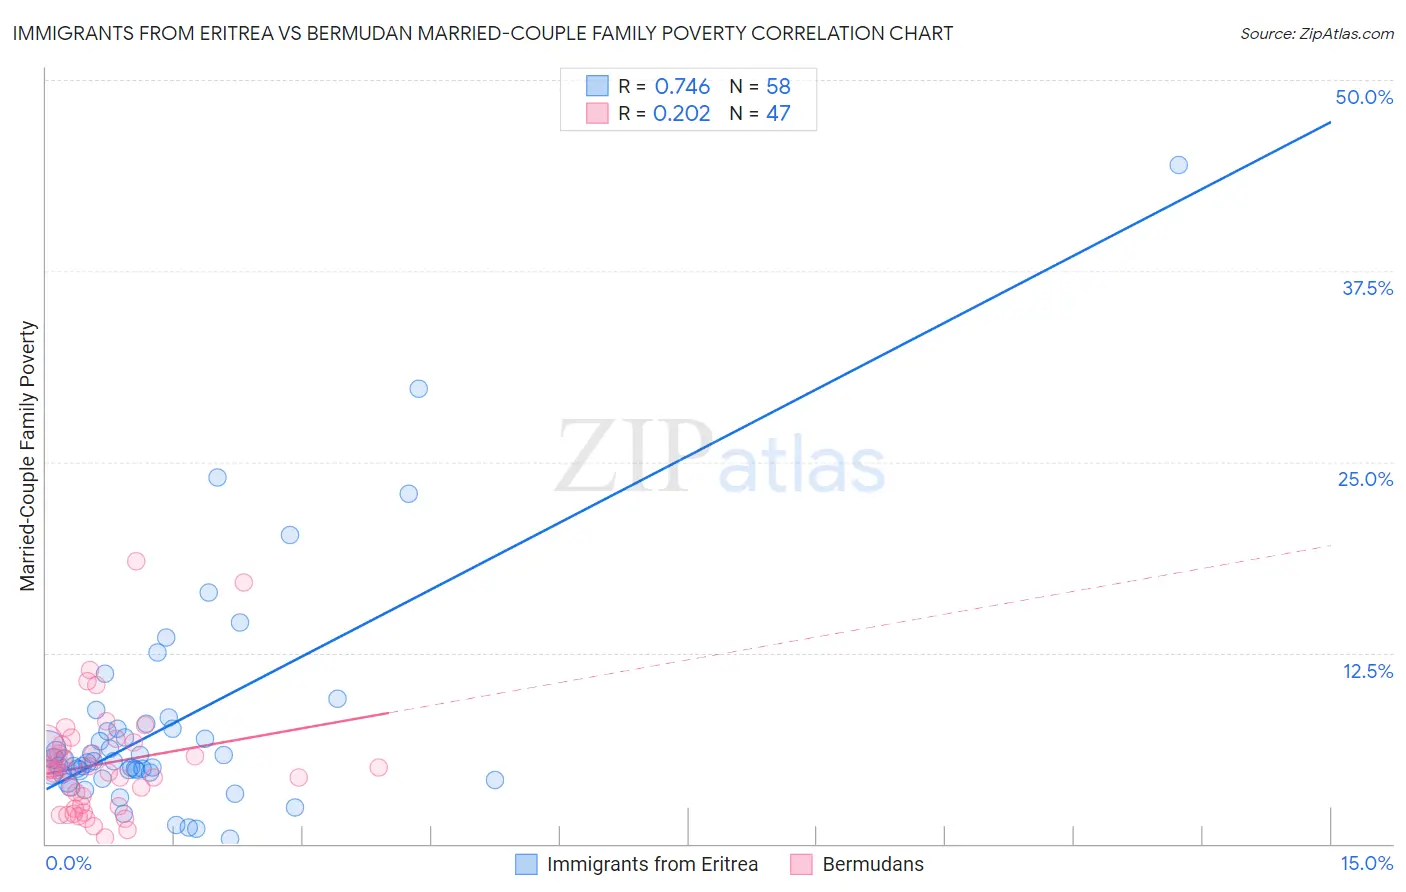
Immigrants from Eritrea vs Bermudan Married-Couple Family Poverty Correlation Chart
The statistical analysis conducted on geographies consisting of 104,722,236 people shows a strong positive correlation between the proportion of Immigrants from Eritrea and poverty level among married-couple families in the United States with a correlation coefficient (R) of 0.746 and weighted average of 5.9%. Similarly, the statistical analysis conducted on geographies consisting of 55,613,061 people shows a weak positive correlation between the proportion of Bermudans and poverty level among married-couple families in the United States with a correlation coefficient (R) of 0.202 and weighted average of 5.2%, a difference of 13.6%.
Married-Couple Family Poverty Correlation Summary
| Measurement | Immigrants from Eritrea | Bermudan |
| Minimum | 0.29% | 0.39% |
| Maximum | 44.4% | 18.5% |
| Range | 44.2% | 18.1% |
| Mean | 7.8% | 5.3% |
| Median | 5.4% | 4.9% |
| Interquartile 25% (IQ1) | 4.7% | 2.5% |
| Interquartile 75% (IQ3) | 7.5% | 6.6% |
| Interquartile Range (IQR) | 2.8% | 4.1% |
| Standard Deviation (Sample) | 7.5% | 3.7% |
| Standard Deviation (Population) | 7.4% | 3.6% |
Similar Demographics by Married-Couple Family Poverty
Demographics Similar to Immigrants from Eritrea by Married-Couple Family Poverty
In terms of married-couple family poverty, the demographic groups most similar to Immigrants from Eritrea are Tsimshian (5.9%, a difference of 0.21%), Immigrants from Ghana (5.9%, a difference of 0.25%), Cree (5.9%, a difference of 0.31%), Iraqi (5.9%, a difference of 0.74%), and Immigrants from Western Asia (6.0%, a difference of 0.89%).
| Demographics | Rating | Rank | Married-Couple Family Poverty |
| Somalis | 2.3 /100 | #243 | Tragic 5.8% |
| Chickasaw | 2.3 /100 | #244 | Tragic 5.8% |
| Immigrants | Afghanistan | 2.1 /100 | #245 | Tragic 5.8% |
| Immigrants | Venezuela | 1.8 /100 | #246 | Tragic 5.8% |
| Iraqis | 1.4 /100 | #247 | Tragic 5.9% |
| Cree | 1.2 /100 | #248 | Tragic 5.9% |
| Tsimshian | 1.1 /100 | #249 | Tragic 5.9% |
| Immigrants | Eritrea | 1.1 /100 | #250 | Tragic 5.9% |
| Immigrants | Ghana | 1.0 /100 | #251 | Tragic 5.9% |
| Immigrants | Western Asia | 0.7 /100 | #252 | Tragic 6.0% |
| Africans | 0.7 /100 | #253 | Tragic 6.0% |
| Immigrants | Somalia | 0.7 /100 | #254 | Tragic 6.0% |
| Comanche | 0.7 /100 | #255 | Tragic 6.0% |
| Bangladeshis | 0.5 /100 | #256 | Tragic 6.0% |
| Immigrants | Burma/Myanmar | 0.5 /100 | #257 | Tragic 6.0% |
Demographics Similar to Bermudans by Married-Couple Family Poverty
In terms of married-couple family poverty, the demographic groups most similar to Bermudans are Immigrants from Argentina (5.2%, a difference of 0.18%), Immigrants from Northern Africa (5.2%, a difference of 0.18%), Ottawa (5.2%, a difference of 0.19%), Alsatian (5.2%, a difference of 0.20%), and Immigrants from Uganda (5.2%, a difference of 0.23%).
| Demographics | Rating | Rank | Married-Couple Family Poverty |
| Hawaiians | 62.3 /100 | #164 | Good 5.1% |
| Immigrants | Malaysia | 62.2 /100 | #165 | Good 5.1% |
| Paraguayans | 61.5 /100 | #166 | Good 5.1% |
| Costa Ricans | 61.5 /100 | #167 | Good 5.1% |
| Immigrants | Uganda | 54.9 /100 | #168 | Average 5.2% |
| Ottawa | 54.5 /100 | #169 | Average 5.2% |
| Immigrants | Argentina | 54.4 /100 | #170 | Average 5.2% |
| Bermudans | 52.9 /100 | #171 | Average 5.2% |
| Immigrants | Northern Africa | 51.3 /100 | #172 | Average 5.2% |
| Alsatians | 51.2 /100 | #173 | Average 5.2% |
| Immigrants | Eastern Africa | 50.0 /100 | #174 | Average 5.2% |
| Marshallese | 47.9 /100 | #175 | Average 5.2% |
| Menominee | 47.8 /100 | #176 | Average 5.2% |
| Immigrants | Kazakhstan | 45.1 /100 | #177 | Average 5.2% |
| Immigrants | Ukraine | 44.9 /100 | #178 | Average 5.2% |