Immigrants from Eritrea vs Bhutanese Single Female Poverty
COMPARE
Immigrants from Eritrea
Bhutanese
Single Female Poverty
Single Female Poverty Comparison
Immigrants from Eritrea
Bhutanese
21.8%
SINGLE FEMALE POVERTY
7.9/ 100
METRIC RATING
222nd/ 347
METRIC RANK
17.7%
SINGLE FEMALE POVERTY
100.0/ 100
METRIC RATING
9th/ 347
METRIC RANK
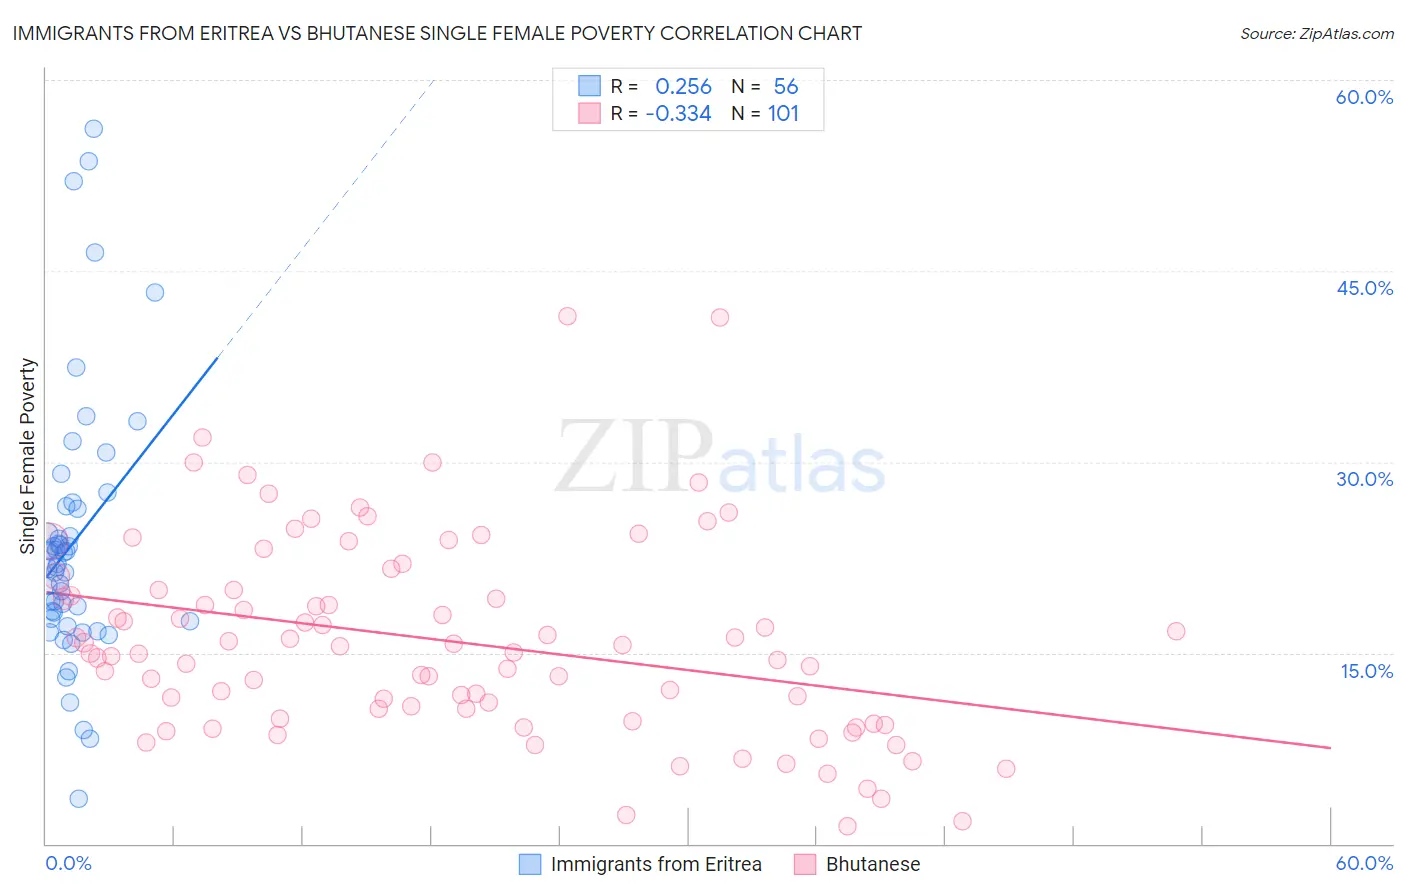
Immigrants from Eritrea vs Bhutanese Single Female Poverty Correlation Chart
The statistical analysis conducted on geographies consisting of 104,658,207 people shows a weak positive correlation between the proportion of Immigrants from Eritrea and poverty level among single females in the United States with a correlation coefficient (R) of 0.256 and weighted average of 21.8%. Similarly, the statistical analysis conducted on geographies consisting of 446,564,428 people shows a mild negative correlation between the proportion of Bhutanese and poverty level among single females in the United States with a correlation coefficient (R) of -0.334 and weighted average of 17.7%, a difference of 23.2%.
Single Female Poverty Correlation Summary
| Measurement | Immigrants from Eritrea | Bhutanese |
| Minimum | 3.5% | 1.3% |
| Maximum | 56.2% | 41.4% |
| Range | 52.6% | 40.1% |
| Mean | 23.7% | 15.9% |
| Median | 21.8% | 15.1% |
| Interquartile 25% (IQ1) | 17.6% | 10.2% |
| Interquartile 75% (IQ3) | 26.4% | 19.9% |
| Interquartile Range (IQR) | 8.8% | 9.7% |
| Standard Deviation (Sample) | 10.5% | 7.8% |
| Standard Deviation (Population) | 10.4% | 7.8% |
Similar Demographics by Single Female Poverty
Demographics Similar to Immigrants from Eritrea by Single Female Poverty
In terms of single female poverty, the demographic groups most similar to Immigrants from Eritrea are Immigrants from Grenada (21.8%, a difference of 0.010%), German (21.8%, a difference of 0.070%), Scottish (21.8%, a difference of 0.14%), Barbadian (21.8%, a difference of 0.16%), and Panamanian (21.7%, a difference of 0.27%).
| Demographics | Rating | Rank | Single Female Poverty |
| Ecuadorians | 12.3 /100 | #215 | Poor 21.6% |
| Immigrants | Barbados | 12.2 /100 | #216 | Poor 21.7% |
| Immigrants | St. Vincent and the Grenadines | 11.7 /100 | #217 | Poor 21.7% |
| Nepalese | 9.7 /100 | #218 | Tragic 21.7% |
| Panamanians | 9.4 /100 | #219 | Tragic 21.7% |
| Germans | 8.3 /100 | #220 | Tragic 21.8% |
| Immigrants | Grenada | 8.0 /100 | #221 | Tragic 21.8% |
| Immigrants | Eritrea | 7.9 /100 | #222 | Tragic 21.8% |
| Scottish | 7.3 /100 | #223 | Tragic 21.8% |
| Barbadians | 7.2 /100 | #224 | Tragic 21.8% |
| English | 6.4 /100 | #225 | Tragic 21.9% |
| Immigrants | Portugal | 5.8 /100 | #226 | Tragic 21.9% |
| Immigrants | Ghana | 5.8 /100 | #227 | Tragic 21.9% |
| Salvadorans | 5.5 /100 | #228 | Tragic 21.9% |
| Tlingit-Haida | 5.4 /100 | #229 | Tragic 21.9% |
Demographics Similar to Bhutanese by Single Female Poverty
In terms of single female poverty, the demographic groups most similar to Bhutanese are Immigrants from Ireland (17.8%, a difference of 0.41%), Immigrants from Lithuania (17.8%, a difference of 0.50%), Immigrants from South Central Asia (17.8%, a difference of 0.56%), Immigrants from Bolivia (17.8%, a difference of 0.82%), and Bolivian (17.9%, a difference of 1.3%).
| Demographics | Rating | Rank | Single Female Poverty |
| Immigrants | Taiwan | 100.0 /100 | #2 | Exceptional 16.4% |
| Immigrants | Hong Kong | 100.0 /100 | #3 | Exceptional 16.5% |
| Immigrants | India | 100.0 /100 | #4 | Exceptional 16.8% |
| Assyrians/Chaldeans/Syriacs | 100.0 /100 | #5 | Exceptional 17.0% |
| Filipinos | 100.0 /100 | #6 | Exceptional 17.0% |
| Thais | 100.0 /100 | #7 | Exceptional 17.3% |
| Immigrants | Iran | 100.0 /100 | #8 | Exceptional 17.5% |
| Bhutanese | 100.0 /100 | #9 | Exceptional 17.7% |
| Immigrants | Ireland | 100.0 /100 | #10 | Exceptional 17.8% |
| Immigrants | Lithuania | 100.0 /100 | #11 | Exceptional 17.8% |
| Immigrants | South Central Asia | 100.0 /100 | #12 | Exceptional 17.8% |
| Immigrants | Bolivia | 100.0 /100 | #13 | Exceptional 17.8% |
| Bolivians | 100.0 /100 | #14 | Exceptional 17.9% |
| Indians (Asian) | 100.0 /100 | #15 | Exceptional 17.9% |
| Iranians | 100.0 /100 | #16 | Exceptional 18.0% |