Immigrants from Canada vs Immigrants from Uruguay Single Female Poverty
COMPARE
Immigrants from Canada
Immigrants from Uruguay
Single Female Poverty
Single Female Poverty Comparison
Immigrants from Canada
Immigrants from Uruguay
20.2%
SINGLE FEMALE POVERTY
91.2/ 100
METRIC RATING
136th/ 347
METRIC RANK
20.6%
SINGLE FEMALE POVERTY
77.7/ 100
METRIC RATING
152nd/ 347
METRIC RANK
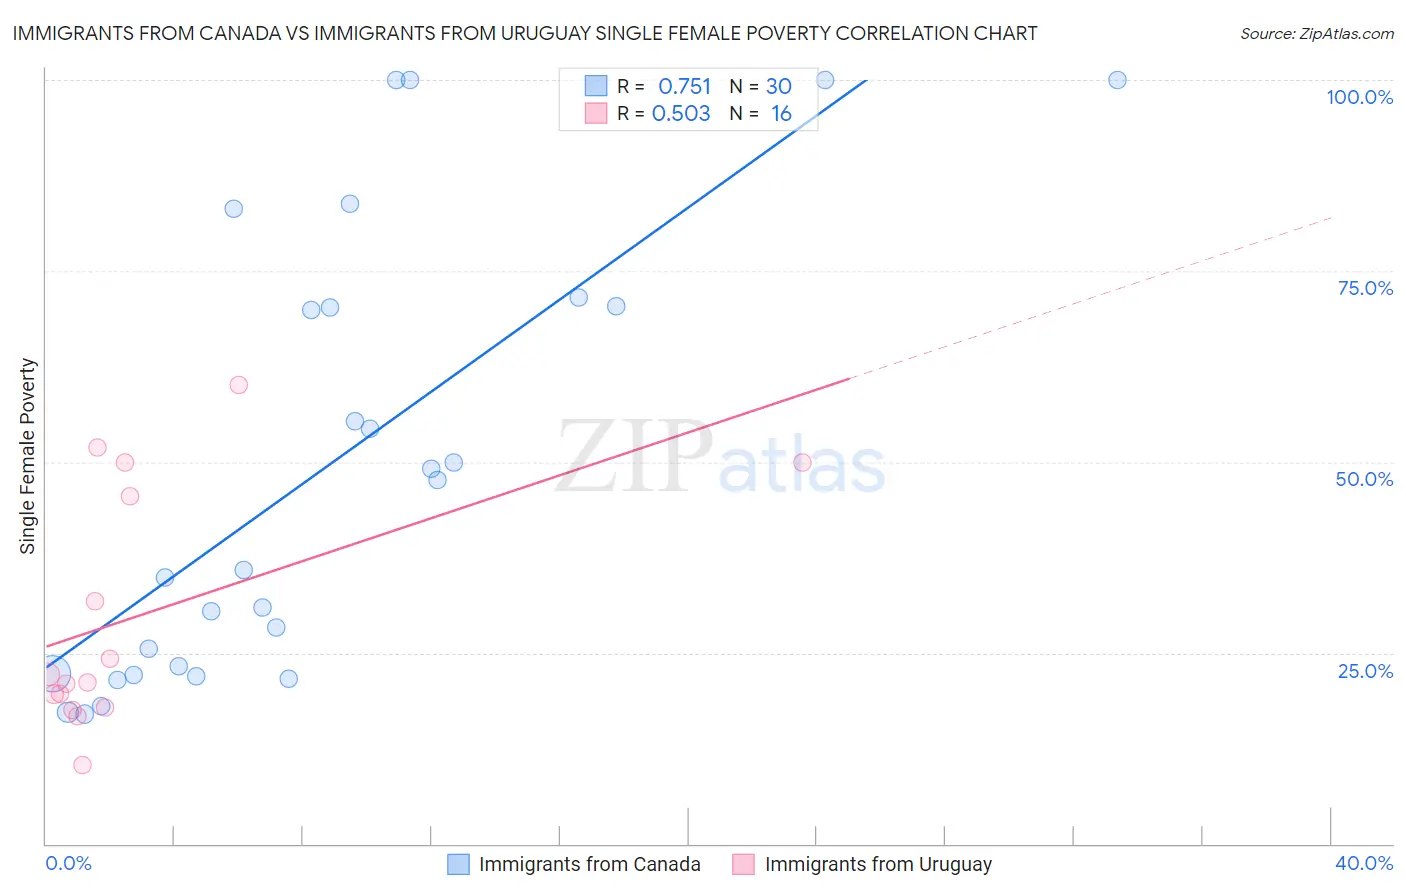
Immigrants from Canada vs Immigrants from Uruguay Single Female Poverty Correlation Chart
The statistical analysis conducted on geographies consisting of 448,621,148 people shows a strong positive correlation between the proportion of Immigrants from Canada and poverty level among single females in the United States with a correlation coefficient (R) of 0.751 and weighted average of 20.2%. Similarly, the statistical analysis conducted on geographies consisting of 132,556,340 people shows a substantial positive correlation between the proportion of Immigrants from Uruguay and poverty level among single females in the United States with a correlation coefficient (R) of 0.503 and weighted average of 20.6%, a difference of 1.8%.
Single Female Poverty Correlation Summary
| Measurement | Immigrants from Canada | Immigrants from Uruguay |
| Minimum | 17.0% | 10.4% |
| Maximum | 100.0% | 60.0% |
| Range | 83.0% | 49.6% |
| Mean | 49.2% | 29.9% |
| Median | 41.8% | 21.6% |
| Interquartile 25% (IQ1) | 22.2% | 18.7% |
| Interquartile 75% (IQ3) | 70.4% | 47.7% |
| Interquartile Range (IQR) | 48.2% | 29.0% |
| Standard Deviation (Sample) | 28.8% | 15.8% |
| Standard Deviation (Population) | 28.3% | 15.3% |
Demographics Similar to Immigrants from Canada and Immigrants from Uruguay by Single Female Poverty
In terms of single female poverty, the demographic groups most similar to Immigrants from Canada are Immigrants from Iraq (20.2%, a difference of 0.010%), Immigrants from Venezuela (20.2%, a difference of 0.060%), Immigrants from Nepal (20.3%, a difference of 0.11%), Slovene (20.3%, a difference of 0.14%), and Immigrants from Kuwait (20.3%, a difference of 0.15%). Similarly, the demographic groups most similar to Immigrants from Uruguay are Swedish (20.6%, a difference of 0.050%), Immigrants from Western Europe (20.6%, a difference of 0.080%), Puget Sound Salish (20.6%, a difference of 0.19%), Immigrants from Denmark (20.5%, a difference of 0.28%), and Portuguese (20.5%, a difference of 0.38%).
| Demographics | Rating | Rank | Single Female Poverty |
| Immigrants | Venezuela | 91.5 /100 | #134 | Exceptional 20.2% |
| Immigrants | Iraq | 91.2 /100 | #135 | Exceptional 20.2% |
| Immigrants | Canada | 91.2 /100 | #136 | Exceptional 20.2% |
| Immigrants | Nepal | 90.6 /100 | #137 | Exceptional 20.3% |
| Slovenes | 90.5 /100 | #138 | Exceptional 20.3% |
| Immigrants | Kuwait | 90.4 /100 | #139 | Exceptional 20.3% |
| Syrians | 90.4 /100 | #140 | Exceptional 20.3% |
| Immigrants | North America | 89.5 /100 | #141 | Excellent 20.3% |
| Immigrants | Uganda | 89.1 /100 | #142 | Excellent 20.3% |
| Australians | 88.4 /100 | #143 | Excellent 20.3% |
| Immigrants | Uzbekistan | 88.3 /100 | #144 | Excellent 20.3% |
| Austrians | 85.8 /100 | #145 | Excellent 20.4% |
| Venezuelans | 85.5 /100 | #146 | Excellent 20.4% |
| South Africans | 85.3 /100 | #147 | Excellent 20.4% |
| Luxembourgers | 84.9 /100 | #148 | Excellent 20.4% |
| Portuguese | 81.5 /100 | #149 | Excellent 20.5% |
| Immigrants | Denmark | 80.5 /100 | #150 | Excellent 20.5% |
| Puget Sound Salish | 79.6 /100 | #151 | Good 20.6% |
| Immigrants | Uruguay | 77.7 /100 | #152 | Good 20.6% |
| Swedes | 77.1 /100 | #153 | Good 20.6% |
| Immigrants | Western Europe | 76.7 /100 | #154 | Good 20.6% |