Immigrants from Canada vs Comanche Single Female Poverty
COMPARE
Immigrants from Canada
Comanche
Single Female Poverty
Single Female Poverty Comparison
Immigrants from Canada
Comanche
20.2%
SINGLE FEMALE POVERTY
91.2/ 100
METRIC RATING
136th/ 347
METRIC RANK
25.6%
SINGLE FEMALE POVERTY
0.0/ 100
METRIC RATING
313th/ 347
METRIC RANK
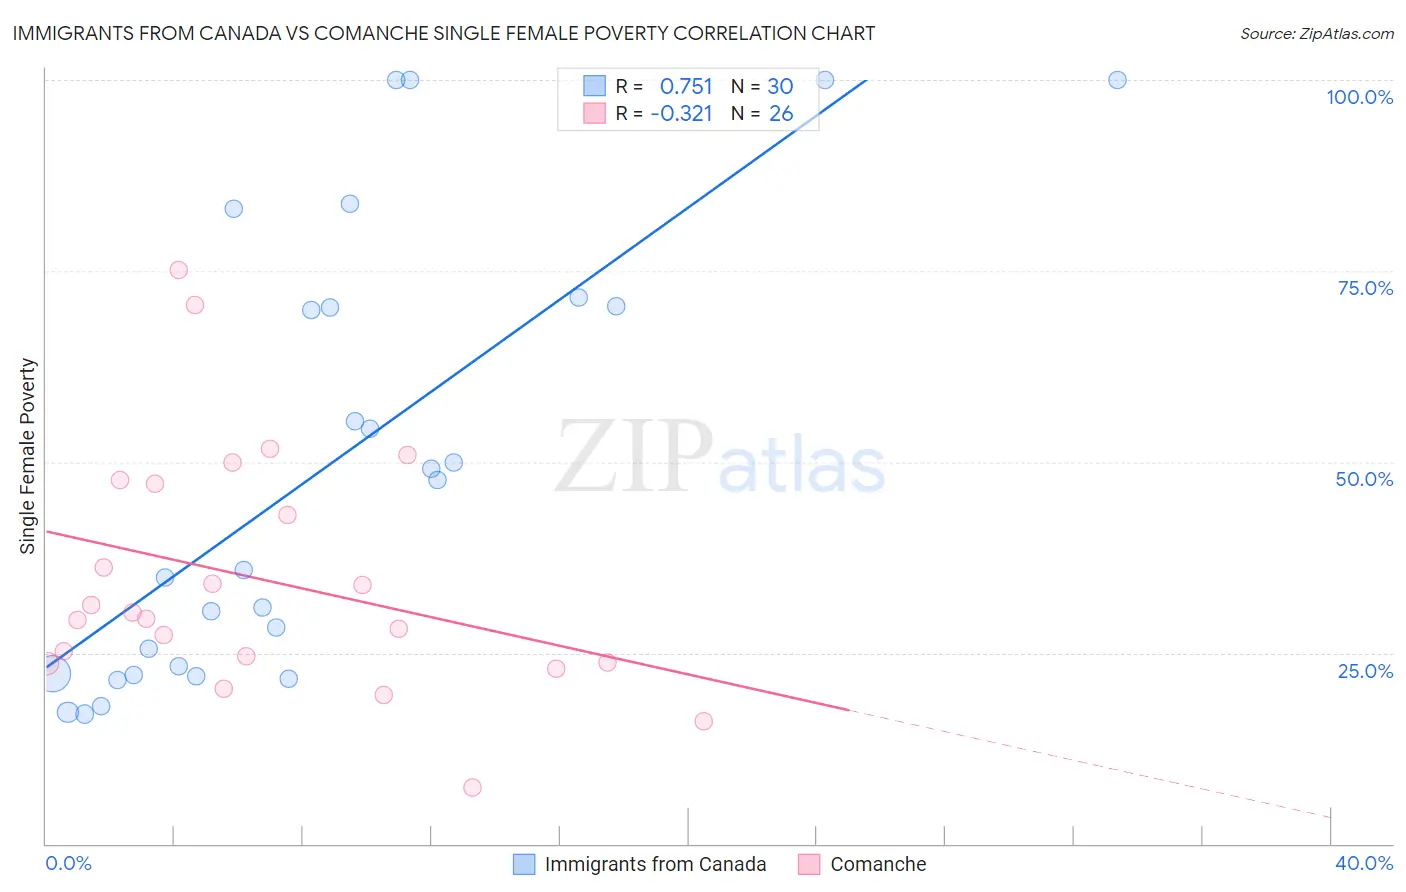
Immigrants from Canada vs Comanche Single Female Poverty Correlation Chart
The statistical analysis conducted on geographies consisting of 448,621,148 people shows a strong positive correlation between the proportion of Immigrants from Canada and poverty level among single females in the United States with a correlation coefficient (R) of 0.751 and weighted average of 20.2%. Similarly, the statistical analysis conducted on geographies consisting of 109,354,794 people shows a mild negative correlation between the proportion of Comanche and poverty level among single females in the United States with a correlation coefficient (R) of -0.321 and weighted average of 25.6%, a difference of 26.3%.
Single Female Poverty Correlation Summary
| Measurement | Immigrants from Canada | Comanche |
| Minimum | 17.0% | 7.4% |
| Maximum | 100.0% | 75.2% |
| Range | 83.0% | 67.8% |
| Mean | 49.2% | 34.6% |
| Median | 41.8% | 29.9% |
| Interquartile 25% (IQ1) | 22.2% | 23.8% |
| Interquartile 75% (IQ3) | 70.4% | 47.1% |
| Interquartile Range (IQR) | 48.2% | 23.3% |
| Standard Deviation (Sample) | 28.8% | 16.0% |
| Standard Deviation (Population) | 28.3% | 15.7% |
Similar Demographics by Single Female Poverty
Demographics Similar to Immigrants from Canada by Single Female Poverty
In terms of single female poverty, the demographic groups most similar to Immigrants from Canada are Immigrants from Iraq (20.2%, a difference of 0.010%), Immigrants from Venezuela (20.2%, a difference of 0.060%), Immigrants from Nepal (20.3%, a difference of 0.11%), Slovene (20.3%, a difference of 0.14%), and Immigrants from England (20.2%, a difference of 0.15%).
| Demographics | Rating | Rank | Single Female Poverty |
| Immigrants | Morocco | 92.4 /100 | #129 | Exceptional 20.2% |
| Immigrants | Hungary | 92.3 /100 | #130 | Exceptional 20.2% |
| Pakistanis | 92.1 /100 | #131 | Exceptional 20.2% |
| Uruguayans | 92.1 /100 | #132 | Exceptional 20.2% |
| Immigrants | England | 91.9 /100 | #133 | Exceptional 20.2% |
| Immigrants | Venezuela | 91.5 /100 | #134 | Exceptional 20.2% |
| Immigrants | Iraq | 91.2 /100 | #135 | Exceptional 20.2% |
| Immigrants | Canada | 91.2 /100 | #136 | Exceptional 20.2% |
| Immigrants | Nepal | 90.6 /100 | #137 | Exceptional 20.3% |
| Slovenes | 90.5 /100 | #138 | Exceptional 20.3% |
| Immigrants | Kuwait | 90.4 /100 | #139 | Exceptional 20.3% |
| Syrians | 90.4 /100 | #140 | Exceptional 20.3% |
| Immigrants | North America | 89.5 /100 | #141 | Excellent 20.3% |
| Immigrants | Uganda | 89.1 /100 | #142 | Excellent 20.3% |
| Australians | 88.4 /100 | #143 | Excellent 20.3% |
Demographics Similar to Comanche by Single Female Poverty
In terms of single female poverty, the demographic groups most similar to Comanche are Paiute (25.5%, a difference of 0.11%), Immigrants from Honduras (25.5%, a difference of 0.16%), Cherokee (25.7%, a difference of 0.36%), Central American Indian (25.5%, a difference of 0.44%), and Dominican (25.4%, a difference of 0.59%).
| Demographics | Rating | Rank | Single Female Poverty |
| Immigrants | Mexico | 0.0 /100 | #306 | Tragic 25.3% |
| Potawatomi | 0.0 /100 | #307 | Tragic 25.4% |
| Aleuts | 0.0 /100 | #308 | Tragic 25.4% |
| Dominicans | 0.0 /100 | #309 | Tragic 25.4% |
| Central American Indians | 0.0 /100 | #310 | Tragic 25.5% |
| Immigrants | Honduras | 0.0 /100 | #311 | Tragic 25.5% |
| Paiute | 0.0 /100 | #312 | Tragic 25.5% |
| Comanche | 0.0 /100 | #313 | Tragic 25.6% |
| Cherokee | 0.0 /100 | #314 | Tragic 25.7% |
| Iroquois | 0.0 /100 | #315 | Tragic 25.7% |
| Immigrants | Somalia | 0.0 /100 | #316 | Tragic 25.8% |
| Ottawa | 0.0 /100 | #317 | Tragic 26.0% |
| Chickasaw | 0.0 /100 | #318 | Tragic 26.3% |
| Blacks/African Americans | 0.0 /100 | #319 | Tragic 26.4% |
| Arapaho | 0.0 /100 | #320 | Tragic 26.4% |