Senegalese vs Sudanese Single Mother Poverty
COMPARE
Senegalese
Sudanese
Single Mother Poverty
Single Mother Poverty Comparison
Senegalese
Sudanese
31.0%
SINGLE MOTHER POVERTY
0.5/ 100
METRIC RATING
254th/ 347
METRIC RANK
30.0%
SINGLE MOTHER POVERTY
7.6/ 100
METRIC RATING
222nd/ 347
METRIC RANK
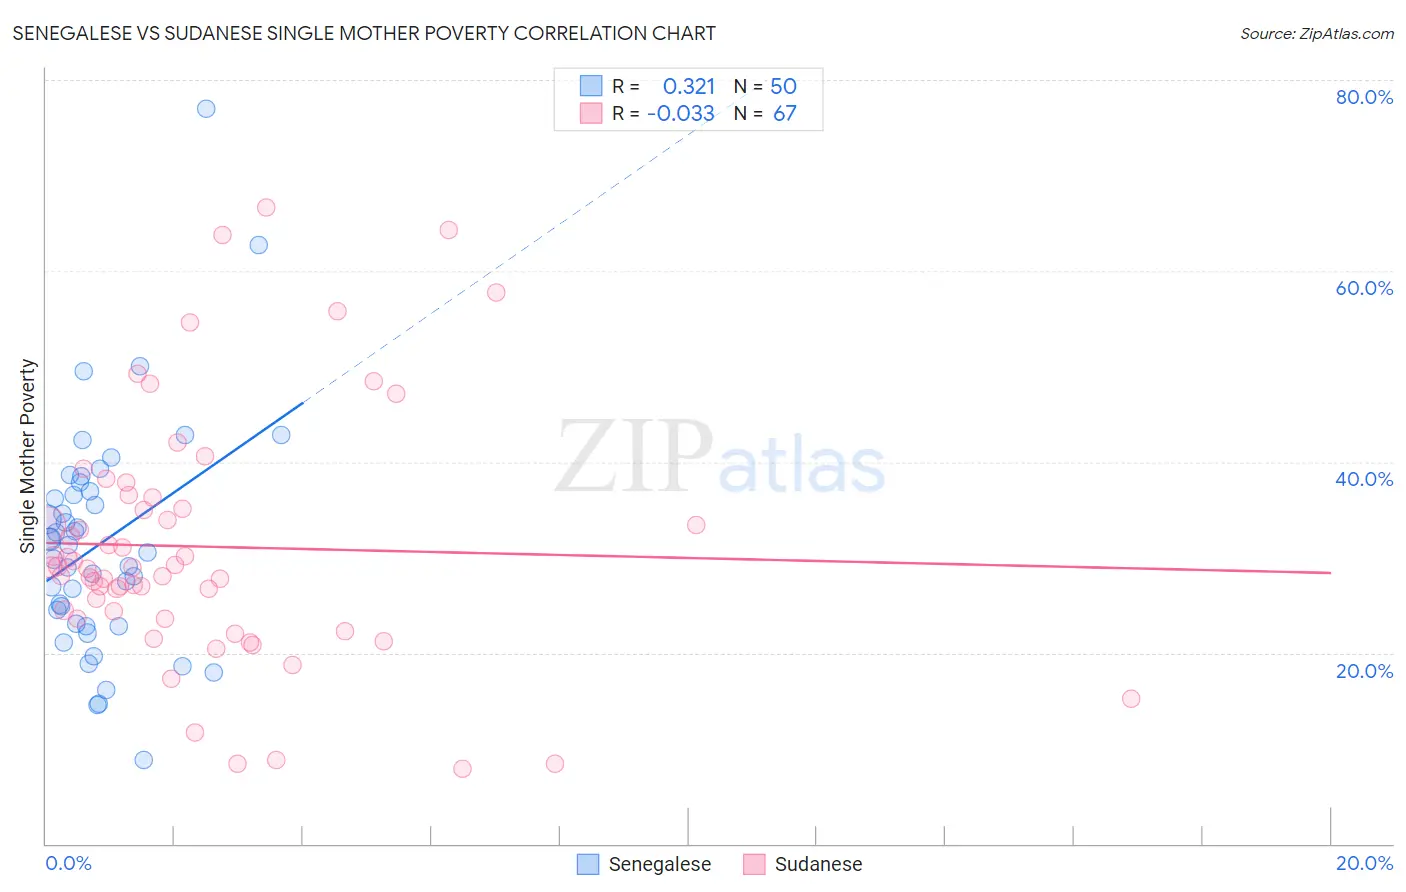
Senegalese vs Sudanese Single Mother Poverty Correlation Chart
The statistical analysis conducted on geographies consisting of 77,710,183 people shows a mild positive correlation between the proportion of Senegalese and poverty level among single mothers in the United States with a correlation coefficient (R) of 0.321 and weighted average of 31.0%. Similarly, the statistical analysis conducted on geographies consisting of 109,550,983 people shows no correlation between the proportion of Sudanese and poverty level among single mothers in the United States with a correlation coefficient (R) of -0.033 and weighted average of 30.0%, a difference of 3.1%.
Single Mother Poverty Correlation Summary
| Measurement | Senegalese | Sudanese |
| Minimum | 8.8% | 7.9% |
| Maximum | 77.0% | 66.7% |
| Range | 68.2% | 58.8% |
| Mean | 31.5% | 31.1% |
| Median | 30.9% | 28.9% |
| Interquartile 25% (IQ1) | 23.0% | 23.6% |
| Interquartile 75% (IQ3) | 36.9% | 36.3% |
| Interquartile Range (IQR) | 13.9% | 12.7% |
| Standard Deviation (Sample) | 12.1% | 13.0% |
| Standard Deviation (Population) | 11.9% | 12.9% |
Similar Demographics by Single Mother Poverty
Demographics Similar to Senegalese by Single Mother Poverty
In terms of single mother poverty, the demographic groups most similar to Senegalese are Belizean (31.0%, a difference of 0.11%), Celtic (30.9%, a difference of 0.14%), Tlingit-Haida (30.9%, a difference of 0.18%), Alaska Native (30.9%, a difference of 0.18%), and Vietnamese (30.9%, a difference of 0.31%).
| Demographics | Rating | Rank | Single Mother Poverty |
| West Indians | 0.9 /100 | #247 | Tragic 30.8% |
| French Canadians | 0.9 /100 | #248 | Tragic 30.8% |
| Cape Verdeans | 0.8 /100 | #249 | Tragic 30.8% |
| Vietnamese | 0.7 /100 | #250 | Tragic 30.9% |
| Tlingit-Haida | 0.6 /100 | #251 | Tragic 30.9% |
| Alaska Natives | 0.6 /100 | #252 | Tragic 30.9% |
| Celtics | 0.6 /100 | #253 | Tragic 30.9% |
| Senegalese | 0.5 /100 | #254 | Tragic 31.0% |
| Belizeans | 0.5 /100 | #255 | Tragic 31.0% |
| Immigrants | West Indies | 0.4 /100 | #256 | Tragic 31.1% |
| Immigrants | Bahamas | 0.4 /100 | #257 | Tragic 31.1% |
| Immigrants | Caribbean | 0.4 /100 | #258 | Tragic 31.1% |
| Immigrants | Bangladesh | 0.4 /100 | #259 | Tragic 31.1% |
| Whites/Caucasians | 0.3 /100 | #260 | Tragic 31.2% |
| Immigrants | El Salvador | 0.3 /100 | #261 | Tragic 31.2% |
Demographics Similar to Sudanese by Single Mother Poverty
In terms of single mother poverty, the demographic groups most similar to Sudanese are Immigrants from Eritrea (30.0%, a difference of 0.010%), Immigrants from Cuba (30.1%, a difference of 0.13%), German (30.0%, a difference of 0.18%), Immigrants from Sudan (30.1%, a difference of 0.20%), and Spanish (30.1%, a difference of 0.23%).
| Demographics | Rating | Rank | Single Mother Poverty |
| Jamaicans | 11.7 /100 | #215 | Poor 29.9% |
| Immigrants | Western Africa | 11.5 /100 | #216 | Poor 29.9% |
| Immigrants | Ghana | 11.3 /100 | #217 | Poor 29.9% |
| Hungarians | 10.3 /100 | #218 | Poor 29.9% |
| Finns | 9.3 /100 | #219 | Tragic 30.0% |
| Germans | 8.8 /100 | #220 | Tragic 30.0% |
| Immigrants | Eritrea | 7.7 /100 | #221 | Tragic 30.0% |
| Sudanese | 7.6 /100 | #222 | Tragic 30.0% |
| Immigrants | Cuba | 6.9 /100 | #223 | Tragic 30.1% |
| Immigrants | Sudan | 6.5 /100 | #224 | Tragic 30.1% |
| Spanish | 6.3 /100 | #225 | Tragic 30.1% |
| Scottish | 6.0 /100 | #226 | Tragic 30.1% |
| Immigrants | Liberia | 5.9 /100 | #227 | Tragic 30.1% |
| Spaniards | 5.4 /100 | #228 | Tragic 30.2% |
| Immigrants | Barbados | 5.0 /100 | #229 | Tragic 30.2% |