Guatemalan vs Sudanese Single Mother Poverty
COMPARE
Guatemalan
Sudanese
Single Mother Poverty
Single Mother Poverty Comparison
Guatemalans
Sudanese
32.9%
SINGLE MOTHER POVERTY
0.0/ 100
METRIC RATING
291st/ 347
METRIC RANK
30.0%
SINGLE MOTHER POVERTY
7.6/ 100
METRIC RATING
222nd/ 347
METRIC RANK
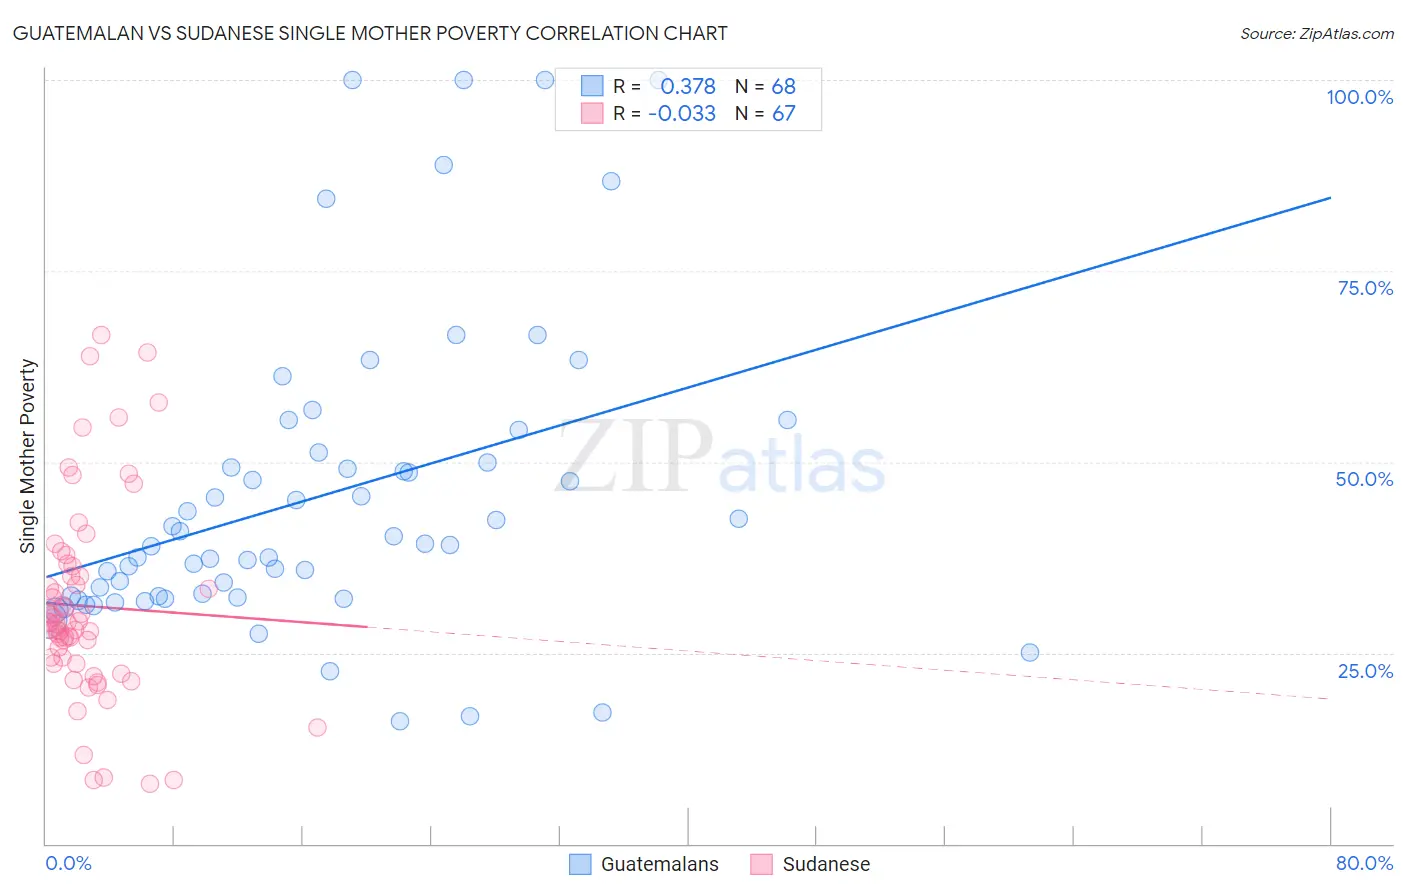
Guatemalan vs Sudanese Single Mother Poverty Correlation Chart
The statistical analysis conducted on geographies consisting of 401,916,262 people shows a mild positive correlation between the proportion of Guatemalans and poverty level among single mothers in the United States with a correlation coefficient (R) of 0.378 and weighted average of 32.9%. Similarly, the statistical analysis conducted on geographies consisting of 109,550,983 people shows no correlation between the proportion of Sudanese and poverty level among single mothers in the United States with a correlation coefficient (R) of -0.033 and weighted average of 30.0%, a difference of 9.5%.
Single Mother Poverty Correlation Summary
| Measurement | Guatemalan | Sudanese |
| Minimum | 16.0% | 7.9% |
| Maximum | 100.0% | 66.7% |
| Range | 84.0% | 58.8% |
| Mean | 45.6% | 31.1% |
| Median | 39.2% | 28.9% |
| Interquartile 25% (IQ1) | 32.3% | 23.6% |
| Interquartile 75% (IQ3) | 50.6% | 36.3% |
| Interquartile Range (IQR) | 18.3% | 12.7% |
| Standard Deviation (Sample) | 20.1% | 13.0% |
| Standard Deviation (Population) | 19.9% | 12.9% |
Similar Demographics by Single Mother Poverty
Demographics Similar to Guatemalans by Single Mother Poverty
In terms of single mother poverty, the demographic groups most similar to Guatemalans are Shoshone (32.9%, a difference of 0.020%), Aleut (32.9%, a difference of 0.050%), French American Indian (33.1%, a difference of 0.68%), Yaqui (33.1%, a difference of 0.72%), and Blackfeet (33.2%, a difference of 0.88%).
| Demographics | Rating | Rank | Single Mother Poverty |
| Indonesians | 0.0 /100 | #284 | Tragic 32.4% |
| Immigrants | Latin America | 0.0 /100 | #285 | Tragic 32.4% |
| Yup'ik | 0.0 /100 | #286 | Tragic 32.5% |
| Immigrants | Dominica | 0.0 /100 | #287 | Tragic 32.5% |
| Somalis | 0.0 /100 | #288 | Tragic 32.6% |
| U.S. Virgin Islanders | 0.0 /100 | #289 | Tragic 32.6% |
| Osage | 0.0 /100 | #290 | Tragic 32.6% |
| Guatemalans | 0.0 /100 | #291 | Tragic 32.9% |
| Shoshone | 0.0 /100 | #292 | Tragic 32.9% |
| Aleuts | 0.0 /100 | #293 | Tragic 32.9% |
| French American Indians | 0.0 /100 | #294 | Tragic 33.1% |
| Yaqui | 0.0 /100 | #295 | Tragic 33.1% |
| Blackfeet | 0.0 /100 | #296 | Tragic 33.2% |
| Pennsylvania Germans | 0.0 /100 | #297 | Tragic 33.2% |
| Africans | 0.0 /100 | #298 | Tragic 33.3% |
Demographics Similar to Sudanese by Single Mother Poverty
In terms of single mother poverty, the demographic groups most similar to Sudanese are Immigrants from Eritrea (30.0%, a difference of 0.010%), Immigrants from Cuba (30.1%, a difference of 0.13%), German (30.0%, a difference of 0.18%), Immigrants from Sudan (30.1%, a difference of 0.20%), and Spanish (30.1%, a difference of 0.23%).
| Demographics | Rating | Rank | Single Mother Poverty |
| Jamaicans | 11.7 /100 | #215 | Poor 29.9% |
| Immigrants | Western Africa | 11.5 /100 | #216 | Poor 29.9% |
| Immigrants | Ghana | 11.3 /100 | #217 | Poor 29.9% |
| Hungarians | 10.3 /100 | #218 | Poor 29.9% |
| Finns | 9.3 /100 | #219 | Tragic 30.0% |
| Germans | 8.8 /100 | #220 | Tragic 30.0% |
| Immigrants | Eritrea | 7.7 /100 | #221 | Tragic 30.0% |
| Sudanese | 7.6 /100 | #222 | Tragic 30.0% |
| Immigrants | Cuba | 6.9 /100 | #223 | Tragic 30.1% |
| Immigrants | Sudan | 6.5 /100 | #224 | Tragic 30.1% |
| Spanish | 6.3 /100 | #225 | Tragic 30.1% |
| Scottish | 6.0 /100 | #226 | Tragic 30.1% |
| Immigrants | Liberia | 5.9 /100 | #227 | Tragic 30.1% |
| Spaniards | 5.4 /100 | #228 | Tragic 30.2% |
| Immigrants | Barbados | 5.0 /100 | #229 | Tragic 30.2% |