Inupiat vs Sudanese Single Mother Poverty
COMPARE
Inupiat
Sudanese
Single Mother Poverty
Single Mother Poverty Comparison
Inupiat
Sudanese
29.0%
SINGLE MOTHER POVERTY
60.4/ 100
METRIC RATING
166th/ 347
METRIC RANK
30.0%
SINGLE MOTHER POVERTY
7.6/ 100
METRIC RATING
222nd/ 347
METRIC RANK
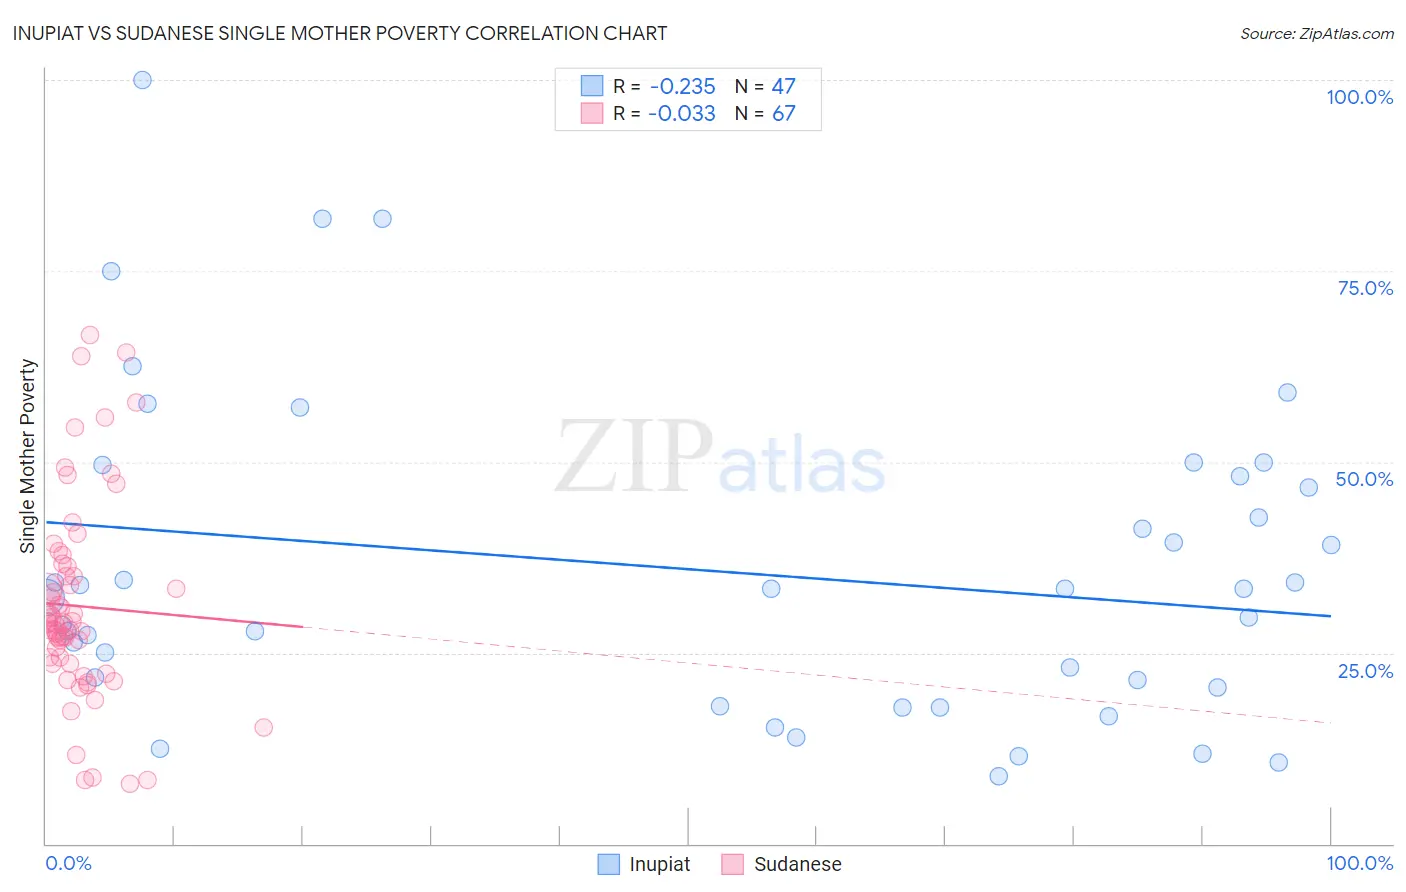
Inupiat vs Sudanese Single Mother Poverty Correlation Chart
The statistical analysis conducted on geographies consisting of 95,875,547 people shows a weak negative correlation between the proportion of Inupiat and poverty level among single mothers in the United States with a correlation coefficient (R) of -0.235 and weighted average of 29.0%. Similarly, the statistical analysis conducted on geographies consisting of 109,550,983 people shows no correlation between the proportion of Sudanese and poverty level among single mothers in the United States with a correlation coefficient (R) of -0.033 and weighted average of 30.0%, a difference of 3.5%.
Single Mother Poverty Correlation Summary
| Measurement | Inupiat | Sudanese |
| Minimum | 8.8% | 7.9% |
| Maximum | 100.0% | 66.7% |
| Range | 91.2% | 58.8% |
| Mean | 35.8% | 31.1% |
| Median | 33.3% | 28.9% |
| Interquartile 25% (IQ1) | 20.5% | 23.6% |
| Interquartile 75% (IQ3) | 48.1% | 36.3% |
| Interquartile Range (IQR) | 27.6% | 12.7% |
| Standard Deviation (Sample) | 20.7% | 13.0% |
| Standard Deviation (Population) | 20.5% | 12.9% |
Similar Demographics by Single Mother Poverty
Demographics Similar to Inupiat by Single Mother Poverty
In terms of single mother poverty, the demographic groups most similar to Inupiat are Arab (29.0%, a difference of 0.020%), Costa Rican (29.0%, a difference of 0.10%), European (29.1%, a difference of 0.14%), Immigrants from Uruguay (29.1%, a difference of 0.16%), and New Zealander (29.1%, a difference of 0.26%).
| Demographics | Rating | Rank | Single Mother Poverty |
| Czechs | 68.4 /100 | #159 | Good 28.9% |
| Japanese | 68.0 /100 | #160 | Good 28.9% |
| Immigrants | Cambodia | 66.6 /100 | #161 | Good 28.9% |
| Scandinavians | 66.2 /100 | #162 | Good 28.9% |
| Immigrants | Nigeria | 65.9 /100 | #163 | Good 28.9% |
| Immigrants | Kenya | 65.9 /100 | #164 | Good 28.9% |
| Arabs | 60.7 /100 | #165 | Good 29.0% |
| Inupiat | 60.4 /100 | #166 | Good 29.0% |
| Costa Ricans | 58.4 /100 | #167 | Average 29.0% |
| Europeans | 57.6 /100 | #168 | Average 29.1% |
| Immigrants | Uruguay | 57.2 /100 | #169 | Average 29.1% |
| New Zealanders | 55.1 /100 | #170 | Average 29.1% |
| Puget Sound Salish | 55.1 /100 | #171 | Average 29.1% |
| Carpatho Rusyns | 53.8 /100 | #172 | Average 29.1% |
| British | 50.6 /100 | #173 | Average 29.2% |
Demographics Similar to Sudanese by Single Mother Poverty
In terms of single mother poverty, the demographic groups most similar to Sudanese are Immigrants from Eritrea (30.0%, a difference of 0.010%), Immigrants from Cuba (30.1%, a difference of 0.13%), German (30.0%, a difference of 0.18%), Immigrants from Sudan (30.1%, a difference of 0.20%), and Spanish (30.1%, a difference of 0.23%).
| Demographics | Rating | Rank | Single Mother Poverty |
| Jamaicans | 11.7 /100 | #215 | Poor 29.9% |
| Immigrants | Western Africa | 11.5 /100 | #216 | Poor 29.9% |
| Immigrants | Ghana | 11.3 /100 | #217 | Poor 29.9% |
| Hungarians | 10.3 /100 | #218 | Poor 29.9% |
| Finns | 9.3 /100 | #219 | Tragic 30.0% |
| Germans | 8.8 /100 | #220 | Tragic 30.0% |
| Immigrants | Eritrea | 7.7 /100 | #221 | Tragic 30.0% |
| Sudanese | 7.6 /100 | #222 | Tragic 30.0% |
| Immigrants | Cuba | 6.9 /100 | #223 | Tragic 30.1% |
| Immigrants | Sudan | 6.5 /100 | #224 | Tragic 30.1% |
| Spanish | 6.3 /100 | #225 | Tragic 30.1% |
| Scottish | 6.0 /100 | #226 | Tragic 30.1% |
| Immigrants | Liberia | 5.9 /100 | #227 | Tragic 30.1% |
| Spaniards | 5.4 /100 | #228 | Tragic 30.2% |
| Immigrants | Barbados | 5.0 /100 | #229 | Tragic 30.2% |