Belgian vs Sudanese Single Mother Poverty
COMPARE
Belgian
Sudanese
Single Mother Poverty
Single Mother Poverty Comparison
Belgians
Sudanese
29.7%
SINGLE MOTHER POVERTY
18.8/ 100
METRIC RATING
201st/ 347
METRIC RANK
30.0%
SINGLE MOTHER POVERTY
7.6/ 100
METRIC RATING
222nd/ 347
METRIC RANK
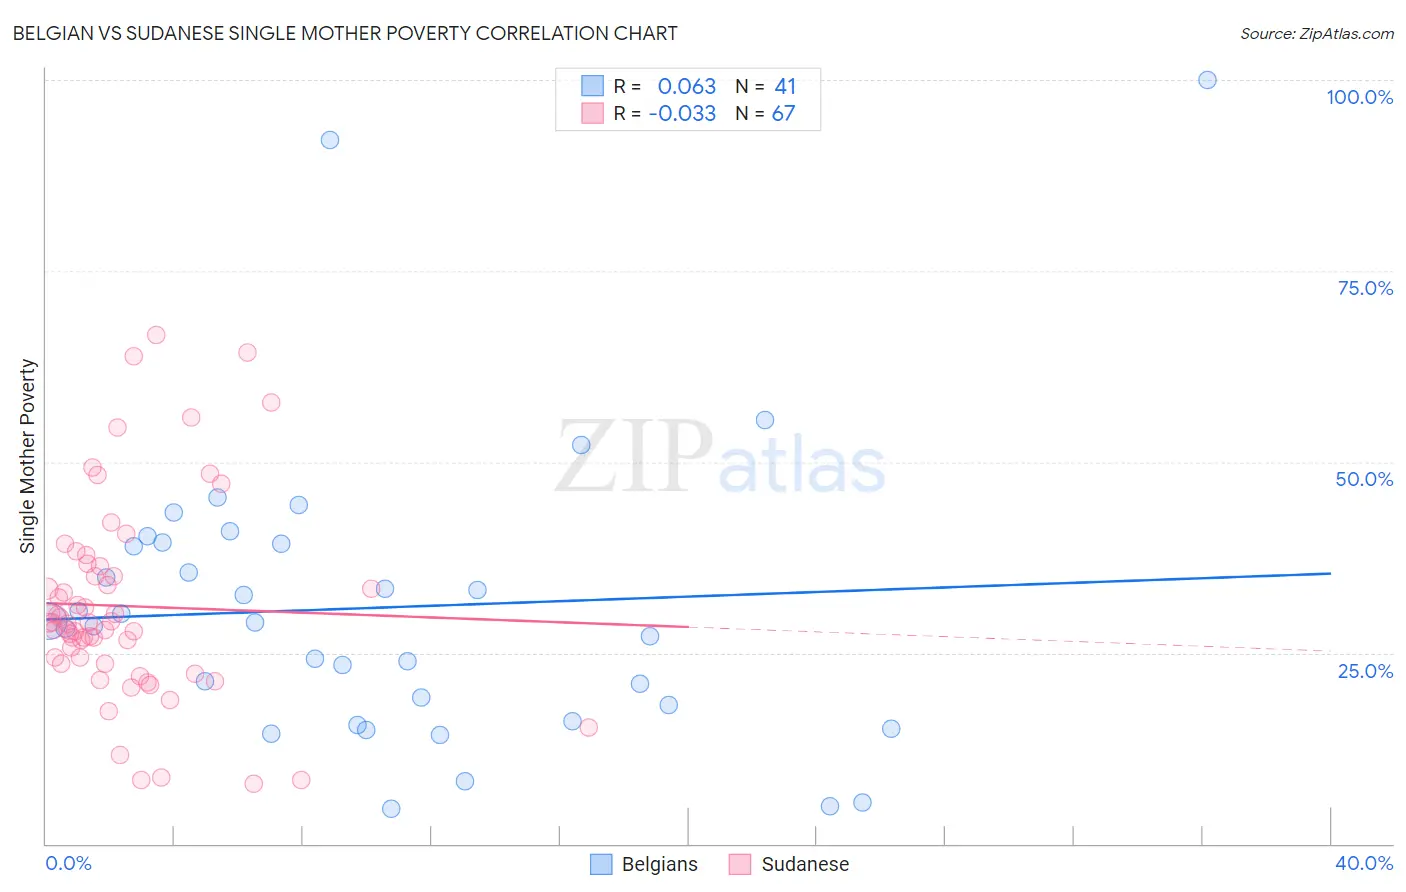
Belgian vs Sudanese Single Mother Poverty Correlation Chart
The statistical analysis conducted on geographies consisting of 346,546,144 people shows a slight positive correlation between the proportion of Belgians and poverty level among single mothers in the United States with a correlation coefficient (R) of 0.063 and weighted average of 29.7%. Similarly, the statistical analysis conducted on geographies consisting of 109,550,983 people shows no correlation between the proportion of Sudanese and poverty level among single mothers in the United States with a correlation coefficient (R) of -0.033 and weighted average of 30.0%, a difference of 1.2%.
Single Mother Poverty Correlation Summary
| Measurement | Belgian | Sudanese |
| Minimum | 4.5% | 7.9% |
| Maximum | 100.0% | 66.7% |
| Range | 95.5% | 58.8% |
| Mean | 30.9% | 31.1% |
| Median | 29.0% | 28.9% |
| Interquartile 25% (IQ1) | 17.1% | 23.6% |
| Interquartile 75% (IQ3) | 39.4% | 36.3% |
| Interquartile Range (IQR) | 22.2% | 12.7% |
| Standard Deviation (Sample) | 19.6% | 13.0% |
| Standard Deviation (Population) | 19.3% | 12.9% |
Similar Demographics by Single Mother Poverty
Demographics Similar to Belgians by Single Mother Poverty
In terms of single mother poverty, the demographic groups most similar to Belgians are Panamanian (29.6%, a difference of 0.10%), Malaysian (29.7%, a difference of 0.10%), Swiss (29.7%, a difference of 0.12%), Cuban (29.6%, a difference of 0.15%), and Immigrants (29.7%, a difference of 0.18%).
| Demographics | Rating | Rank | Single Mother Poverty |
| Icelanders | 26.1 /100 | #194 | Fair 29.5% |
| Slavs | 24.5 /100 | #195 | Fair 29.6% |
| Spanish American Indians | 23.4 /100 | #196 | Fair 29.6% |
| Immigrants | Jamaica | 22.0 /100 | #197 | Fair 29.6% |
| Trinidadians and Tobagonians | 21.7 /100 | #198 | Fair 29.6% |
| Cubans | 20.8 /100 | #199 | Fair 29.6% |
| Panamanians | 20.0 /100 | #200 | Fair 29.6% |
| Belgians | 18.8 /100 | #201 | Poor 29.7% |
| Malaysians | 17.4 /100 | #202 | Poor 29.7% |
| Swiss | 17.2 /100 | #203 | Poor 29.7% |
| Immigrants | Immigrants | 16.6 /100 | #204 | Poor 29.7% |
| Czechoslovakians | 16.1 /100 | #205 | Poor 29.7% |
| Immigrants | Haiti | 15.8 /100 | #206 | Poor 29.7% |
| Immigrants | Panama | 15.5 /100 | #207 | Poor 29.8% |
| Immigrants | Guyana | 14.7 /100 | #208 | Poor 29.8% |
Demographics Similar to Sudanese by Single Mother Poverty
In terms of single mother poverty, the demographic groups most similar to Sudanese are Immigrants from Eritrea (30.0%, a difference of 0.010%), Immigrants from Cuba (30.1%, a difference of 0.13%), German (30.0%, a difference of 0.18%), Immigrants from Sudan (30.1%, a difference of 0.20%), and Spanish (30.1%, a difference of 0.23%).
| Demographics | Rating | Rank | Single Mother Poverty |
| Jamaicans | 11.7 /100 | #215 | Poor 29.9% |
| Immigrants | Western Africa | 11.5 /100 | #216 | Poor 29.9% |
| Immigrants | Ghana | 11.3 /100 | #217 | Poor 29.9% |
| Hungarians | 10.3 /100 | #218 | Poor 29.9% |
| Finns | 9.3 /100 | #219 | Tragic 30.0% |
| Germans | 8.8 /100 | #220 | Tragic 30.0% |
| Immigrants | Eritrea | 7.7 /100 | #221 | Tragic 30.0% |
| Sudanese | 7.6 /100 | #222 | Tragic 30.0% |
| Immigrants | Cuba | 6.9 /100 | #223 | Tragic 30.1% |
| Immigrants | Sudan | 6.5 /100 | #224 | Tragic 30.1% |
| Spanish | 6.3 /100 | #225 | Tragic 30.1% |
| Scottish | 6.0 /100 | #226 | Tragic 30.1% |
| Immigrants | Liberia | 5.9 /100 | #227 | Tragic 30.1% |
| Spaniards | 5.4 /100 | #228 | Tragic 30.2% |
| Immigrants | Barbados | 5.0 /100 | #229 | Tragic 30.2% |