Croatian vs Sudanese Single Mother Poverty
COMPARE
Croatian
Sudanese
Single Mother Poverty
Single Mother Poverty Comparison
Croatians
Sudanese
28.2%
SINGLE MOTHER POVERTY
94.8/ 100
METRIC RATING
110th/ 347
METRIC RANK
30.0%
SINGLE MOTHER POVERTY
7.6/ 100
METRIC RATING
222nd/ 347
METRIC RANK
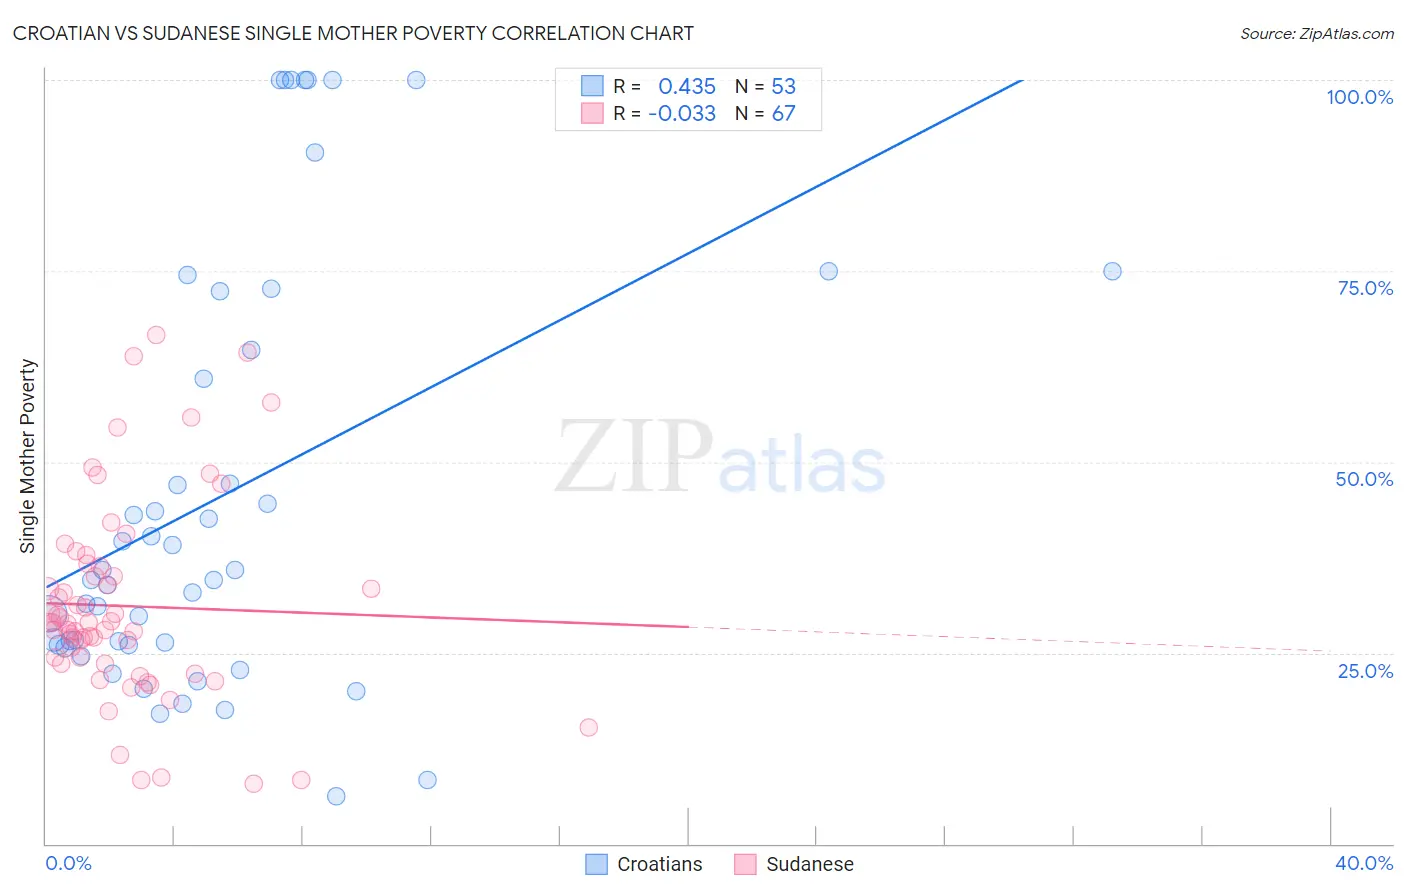
Croatian vs Sudanese Single Mother Poverty Correlation Chart
The statistical analysis conducted on geographies consisting of 364,805,698 people shows a moderate positive correlation between the proportion of Croatians and poverty level among single mothers in the United States with a correlation coefficient (R) of 0.435 and weighted average of 28.2%. Similarly, the statistical analysis conducted on geographies consisting of 109,550,983 people shows no correlation between the proportion of Sudanese and poverty level among single mothers in the United States with a correlation coefficient (R) of -0.033 and weighted average of 30.0%, a difference of 6.7%.
Single Mother Poverty Correlation Summary
| Measurement | Croatian | Sudanese |
| Minimum | 6.2% | 7.9% |
| Maximum | 100.0% | 66.7% |
| Range | 93.8% | 58.8% |
| Mean | 45.5% | 31.1% |
| Median | 34.6% | 28.9% |
| Interquartile 25% (IQ1) | 26.0% | 23.6% |
| Interquartile 75% (IQ3) | 68.5% | 36.3% |
| Interquartile Range (IQR) | 42.5% | 12.7% |
| Standard Deviation (Sample) | 28.0% | 13.0% |
| Standard Deviation (Population) | 27.7% | 12.9% |
Similar Demographics by Single Mother Poverty
Demographics Similar to Croatians by Single Mother Poverty
In terms of single mother poverty, the demographic groups most similar to Croatians are Venezuelan (28.2%, a difference of 0.050%), Immigrants from Kazakhstan (28.2%, a difference of 0.060%), Immigrants from Armenia (28.1%, a difference of 0.12%), Immigrants from Zimbabwe (28.1%, a difference of 0.21%), and Immigrants from Venezuela (28.1%, a difference of 0.29%).
| Demographics | Rating | Rank | Single Mother Poverty |
| Immigrants | Northern Africa | 96.6 /100 | #103 | Exceptional 28.0% |
| Italians | 96.6 /100 | #104 | Exceptional 28.0% |
| Israelis | 96.5 /100 | #105 | Exceptional 28.0% |
| Ukrainians | 96.4 /100 | #106 | Exceptional 28.0% |
| Immigrants | Venezuela | 95.8 /100 | #107 | Exceptional 28.1% |
| Immigrants | Zimbabwe | 95.5 /100 | #108 | Exceptional 28.1% |
| Immigrants | Armenia | 95.2 /100 | #109 | Exceptional 28.1% |
| Croatians | 94.8 /100 | #110 | Exceptional 28.2% |
| Venezuelans | 94.5 /100 | #111 | Exceptional 28.2% |
| Immigrants | Kazakhstan | 94.5 /100 | #112 | Exceptional 28.2% |
| Immigrants | South Africa | 93.2 /100 | #113 | Exceptional 28.3% |
| Immigrants | Western Asia | 92.7 /100 | #114 | Exceptional 28.3% |
| Immigrants | Kuwait | 92.7 /100 | #115 | Exceptional 28.3% |
| Immigrants | Uganda | 92.5 /100 | #116 | Exceptional 28.3% |
| Australians | 92.5 /100 | #117 | Exceptional 28.3% |
Demographics Similar to Sudanese by Single Mother Poverty
In terms of single mother poverty, the demographic groups most similar to Sudanese are Immigrants from Eritrea (30.0%, a difference of 0.010%), Immigrants from Cuba (30.1%, a difference of 0.13%), German (30.0%, a difference of 0.18%), Immigrants from Sudan (30.1%, a difference of 0.20%), and Spanish (30.1%, a difference of 0.23%).
| Demographics | Rating | Rank | Single Mother Poverty |
| Jamaicans | 11.7 /100 | #215 | Poor 29.9% |
| Immigrants | Western Africa | 11.5 /100 | #216 | Poor 29.9% |
| Immigrants | Ghana | 11.3 /100 | #217 | Poor 29.9% |
| Hungarians | 10.3 /100 | #218 | Poor 29.9% |
| Finns | 9.3 /100 | #219 | Tragic 30.0% |
| Germans | 8.8 /100 | #220 | Tragic 30.0% |
| Immigrants | Eritrea | 7.7 /100 | #221 | Tragic 30.0% |
| Sudanese | 7.6 /100 | #222 | Tragic 30.0% |
| Immigrants | Cuba | 6.9 /100 | #223 | Tragic 30.1% |
| Immigrants | Sudan | 6.5 /100 | #224 | Tragic 30.1% |
| Spanish | 6.3 /100 | #225 | Tragic 30.1% |
| Scottish | 6.0 /100 | #226 | Tragic 30.1% |
| Immigrants | Liberia | 5.9 /100 | #227 | Tragic 30.1% |
| Spaniards | 5.4 /100 | #228 | Tragic 30.2% |
| Immigrants | Barbados | 5.0 /100 | #229 | Tragic 30.2% |