Laotian vs Immigrants from Europe Single Mother Poverty
COMPARE
Laotian
Immigrants from Europe
Single Mother Poverty
Single Mother Poverty Comparison
Laotians
Immigrants from Europe
27.0%
SINGLE MOTHER POVERTY
99.8/ 100
METRIC RATING
50th/ 347
METRIC RANK
27.4%
SINGLE MOTHER POVERTY
99.3/ 100
METRIC RATING
74th/ 347
METRIC RANK
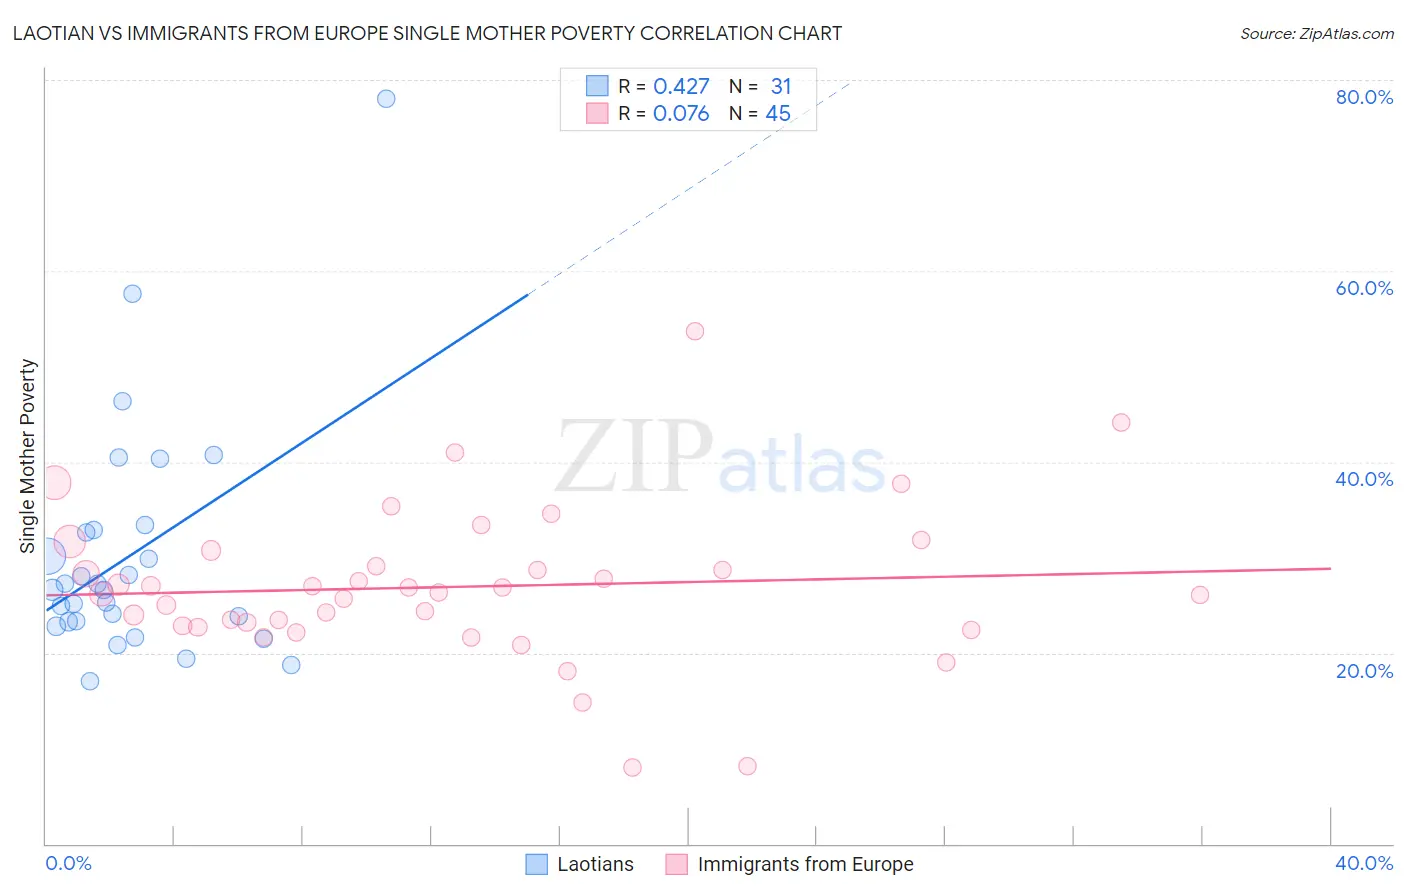
Laotian vs Immigrants from Europe Single Mother Poverty Correlation Chart
The statistical analysis conducted on geographies consisting of 221,717,898 people shows a moderate positive correlation between the proportion of Laotians and poverty level among single mothers in the United States with a correlation coefficient (R) of 0.427 and weighted average of 27.0%. Similarly, the statistical analysis conducted on geographies consisting of 523,370,699 people shows a slight positive correlation between the proportion of Immigrants from Europe and poverty level among single mothers in the United States with a correlation coefficient (R) of 0.076 and weighted average of 27.4%, a difference of 1.8%.
Single Mother Poverty Correlation Summary
| Measurement | Laotian | Immigrants from Europe |
| Minimum | 17.0% | 8.0% |
| Maximum | 78.0% | 53.7% |
| Range | 60.9% | 45.6% |
| Mean | 30.2% | 26.9% |
| Median | 26.6% | 26.4% |
| Interquartile 25% (IQ1) | 23.3% | 22.8% |
| Interquartile 75% (IQ3) | 32.8% | 29.9% |
| Interquartile Range (IQR) | 9.6% | 7.1% |
| Standard Deviation (Sample) | 12.5% | 8.2% |
| Standard Deviation (Population) | 12.3% | 8.1% |
Similar Demographics by Single Mother Poverty
Demographics Similar to Laotians by Single Mother Poverty
In terms of single mother poverty, the demographic groups most similar to Laotians are Cambodian (27.0%, a difference of 0.010%), Immigrants from Poland (26.9%, a difference of 0.090%), Egyptian (26.9%, a difference of 0.17%), Immigrants from Serbia (26.9%, a difference of 0.23%), and Latvian (26.9%, a difference of 0.27%).
| Demographics | Rating | Rank | Single Mother Poverty |
| Tsimshian | 99.9 /100 | #43 | Exceptional 26.8% |
| Immigrants | Sierra Leone | 99.9 /100 | #44 | Exceptional 26.9% |
| Latvians | 99.9 /100 | #45 | Exceptional 26.9% |
| Immigrants | Serbia | 99.9 /100 | #46 | Exceptional 26.9% |
| Egyptians | 99.8 /100 | #47 | Exceptional 26.9% |
| Immigrants | Poland | 99.8 /100 | #48 | Exceptional 26.9% |
| Cambodians | 99.8 /100 | #49 | Exceptional 27.0% |
| Laotians | 99.8 /100 | #50 | Exceptional 27.0% |
| Immigrants | Argentina | 99.7 /100 | #51 | Exceptional 27.1% |
| Immigrants | South Eastern Asia | 99.7 /100 | #52 | Exceptional 27.1% |
| Immigrants | Jordan | 99.7 /100 | #53 | Exceptional 27.1% |
| Immigrants | Bulgaria | 99.7 /100 | #54 | Exceptional 27.1% |
| Immigrants | Egypt | 99.7 /100 | #55 | Exceptional 27.1% |
| Immigrants | Romania | 99.7 /100 | #56 | Exceptional 27.2% |
| Palestinians | 99.7 /100 | #57 | Exceptional 27.2% |
Demographics Similar to Immigrants from Europe by Single Mother Poverty
In terms of single mother poverty, the demographic groups most similar to Immigrants from Europe are Sierra Leonean (27.4%, a difference of 0.060%), Immigrants from Russia (27.4%, a difference of 0.13%), Immigrants from Sweden (27.5%, a difference of 0.13%), Macedonian (27.4%, a difference of 0.15%), and Immigrants from Belarus (27.4%, a difference of 0.17%).
| Demographics | Rating | Rank | Single Mother Poverty |
| Immigrants | Australia | 99.5 /100 | #67 | Exceptional 27.3% |
| Immigrants | Czechoslovakia | 99.5 /100 | #68 | Exceptional 27.4% |
| Lithuanians | 99.4 /100 | #69 | Exceptional 27.4% |
| Immigrants | Belarus | 99.4 /100 | #70 | Exceptional 27.4% |
| Macedonians | 99.4 /100 | #71 | Exceptional 27.4% |
| Immigrants | Russia | 99.4 /100 | #72 | Exceptional 27.4% |
| Sierra Leoneans | 99.3 /100 | #73 | Exceptional 27.4% |
| Immigrants | Europe | 99.3 /100 | #74 | Exceptional 27.4% |
| Immigrants | Sweden | 99.2 /100 | #75 | Exceptional 27.5% |
| Peruvians | 99.2 /100 | #76 | Exceptional 27.5% |
| Immigrants | Peru | 99.2 /100 | #77 | Exceptional 27.5% |
| Immigrants | North Macedonia | 99.2 /100 | #78 | Exceptional 27.5% |
| Immigrants | Italy | 99.1 /100 | #79 | Exceptional 27.5% |
| Taiwanese | 99.1 /100 | #80 | Exceptional 27.5% |
| Immigrants | Scotland | 98.9 /100 | #81 | Exceptional 27.6% |