Israeli vs Immigrants from Europe Single Mother Poverty
COMPARE
Israeli
Immigrants from Europe
Single Mother Poverty
Single Mother Poverty Comparison
Israelis
Immigrants from Europe
28.0%
SINGLE MOTHER POVERTY
96.5/ 100
METRIC RATING
105th/ 347
METRIC RANK
27.4%
SINGLE MOTHER POVERTY
99.3/ 100
METRIC RATING
74th/ 347
METRIC RANK
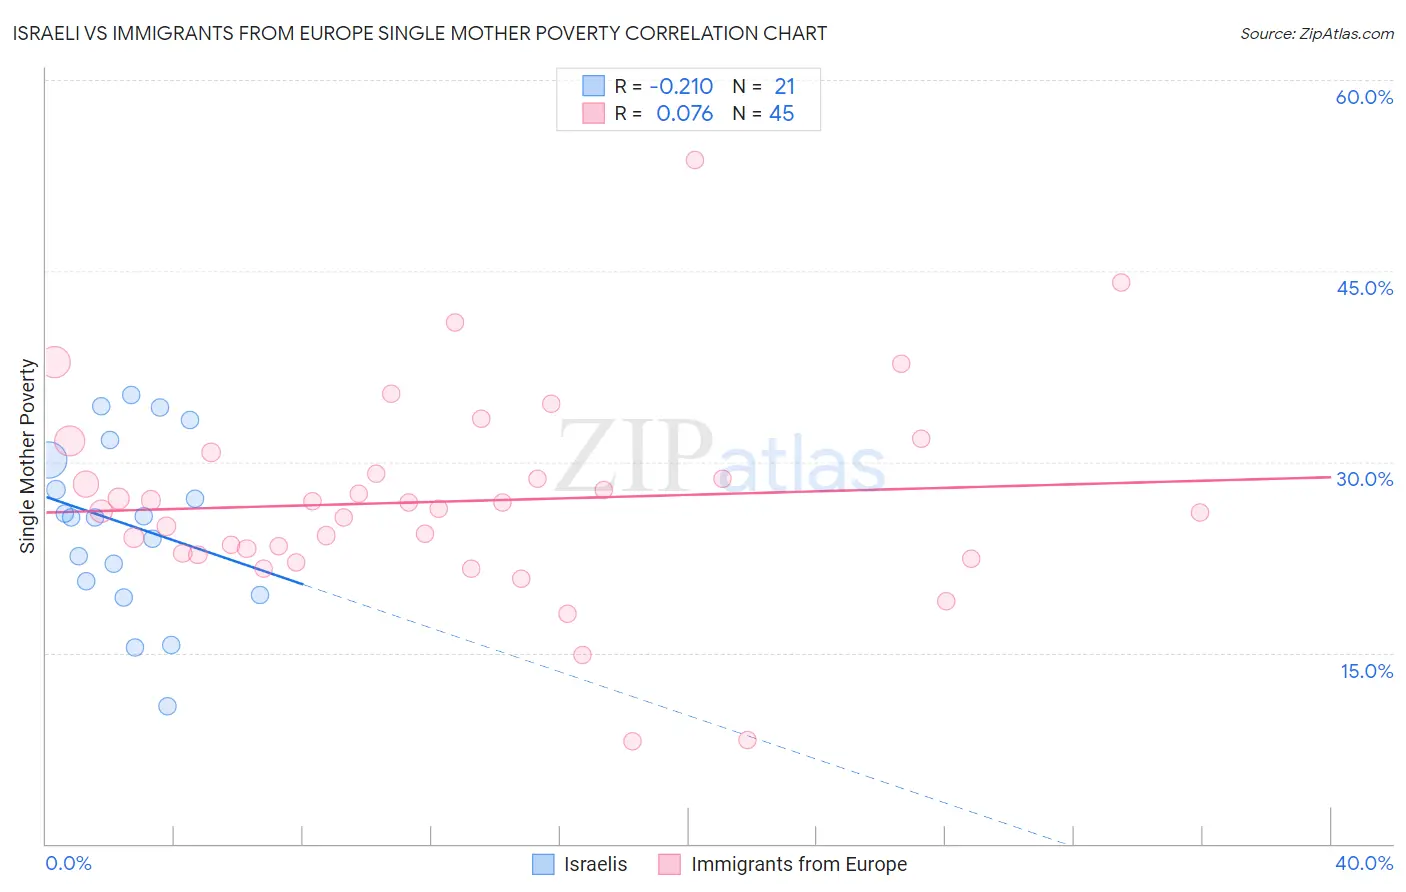
Israeli vs Immigrants from Europe Single Mother Poverty Correlation Chart
The statistical analysis conducted on geographies consisting of 207,028,427 people shows a weak negative correlation between the proportion of Israelis and poverty level among single mothers in the United States with a correlation coefficient (R) of -0.210 and weighted average of 28.0%. Similarly, the statistical analysis conducted on geographies consisting of 523,370,699 people shows a slight positive correlation between the proportion of Immigrants from Europe and poverty level among single mothers in the United States with a correlation coefficient (R) of 0.076 and weighted average of 27.4%, a difference of 2.0%.
Single Mother Poverty Correlation Summary
| Measurement | Israeli | Immigrants from Europe |
| Minimum | 10.8% | 8.0% |
| Maximum | 35.2% | 53.7% |
| Range | 24.4% | 45.6% |
| Mean | 25.1% | 26.9% |
| Median | 25.6% | 26.4% |
| Interquartile 25% (IQ1) | 20.1% | 22.8% |
| Interquartile 75% (IQ3) | 31.0% | 29.9% |
| Interquartile Range (IQR) | 10.9% | 7.1% |
| Standard Deviation (Sample) | 6.8% | 8.2% |
| Standard Deviation (Population) | 6.6% | 8.1% |
Similar Demographics by Single Mother Poverty
Demographics Similar to Israelis by Single Mother Poverty
In terms of single mother poverty, the demographic groups most similar to Israelis are Italian (28.0%, a difference of 0.020%), Immigrants from Northern Africa (28.0%, a difference of 0.040%), Ukrainian (28.0%, a difference of 0.040%), Immigrants from Croatia (28.0%, a difference of 0.060%), and Pakistani (28.0%, a difference of 0.16%).
| Demographics | Rating | Rank | Single Mother Poverty |
| Immigrants | Nepal | 97.2 /100 | #98 | Exceptional 27.9% |
| Immigrants | Netherlands | 97.2 /100 | #99 | Exceptional 27.9% |
| Zimbabweans | 97.1 /100 | #100 | Exceptional 27.9% |
| Pakistanis | 96.9 /100 | #101 | Exceptional 28.0% |
| Immigrants | Croatia | 96.7 /100 | #102 | Exceptional 28.0% |
| Immigrants | Northern Africa | 96.6 /100 | #103 | Exceptional 28.0% |
| Italians | 96.6 /100 | #104 | Exceptional 28.0% |
| Israelis | 96.5 /100 | #105 | Exceptional 28.0% |
| Ukrainians | 96.4 /100 | #106 | Exceptional 28.0% |
| Immigrants | Venezuela | 95.8 /100 | #107 | Exceptional 28.1% |
| Immigrants | Zimbabwe | 95.5 /100 | #108 | Exceptional 28.1% |
| Immigrants | Armenia | 95.2 /100 | #109 | Exceptional 28.1% |
| Croatians | 94.8 /100 | #110 | Exceptional 28.2% |
| Venezuelans | 94.5 /100 | #111 | Exceptional 28.2% |
| Immigrants | Kazakhstan | 94.5 /100 | #112 | Exceptional 28.2% |
Demographics Similar to Immigrants from Europe by Single Mother Poverty
In terms of single mother poverty, the demographic groups most similar to Immigrants from Europe are Sierra Leonean (27.4%, a difference of 0.060%), Immigrants from Russia (27.4%, a difference of 0.13%), Immigrants from Sweden (27.5%, a difference of 0.13%), Macedonian (27.4%, a difference of 0.15%), and Immigrants from Belarus (27.4%, a difference of 0.17%).
| Demographics | Rating | Rank | Single Mother Poverty |
| Immigrants | Australia | 99.5 /100 | #67 | Exceptional 27.3% |
| Immigrants | Czechoslovakia | 99.5 /100 | #68 | Exceptional 27.4% |
| Lithuanians | 99.4 /100 | #69 | Exceptional 27.4% |
| Immigrants | Belarus | 99.4 /100 | #70 | Exceptional 27.4% |
| Macedonians | 99.4 /100 | #71 | Exceptional 27.4% |
| Immigrants | Russia | 99.4 /100 | #72 | Exceptional 27.4% |
| Sierra Leoneans | 99.3 /100 | #73 | Exceptional 27.4% |
| Immigrants | Europe | 99.3 /100 | #74 | Exceptional 27.4% |
| Immigrants | Sweden | 99.2 /100 | #75 | Exceptional 27.5% |
| Peruvians | 99.2 /100 | #76 | Exceptional 27.5% |
| Immigrants | Peru | 99.2 /100 | #77 | Exceptional 27.5% |
| Immigrants | North Macedonia | 99.2 /100 | #78 | Exceptional 27.5% |
| Immigrants | Italy | 99.1 /100 | #79 | Exceptional 27.5% |
| Taiwanese | 99.1 /100 | #80 | Exceptional 27.5% |
| Immigrants | Scotland | 98.9 /100 | #81 | Exceptional 27.6% |