Scotch-Irish vs Immigrants from Europe Single Mother Poverty
COMPARE
Scotch-Irish
Immigrants from Europe
Single Mother Poverty
Single Mother Poverty Comparison
Scotch-Irish
Immigrants from Europe
31.5%
SINGLE MOTHER POVERTY
0.1/ 100
METRIC RATING
269th/ 347
METRIC RANK
27.4%
SINGLE MOTHER POVERTY
99.3/ 100
METRIC RATING
74th/ 347
METRIC RANK
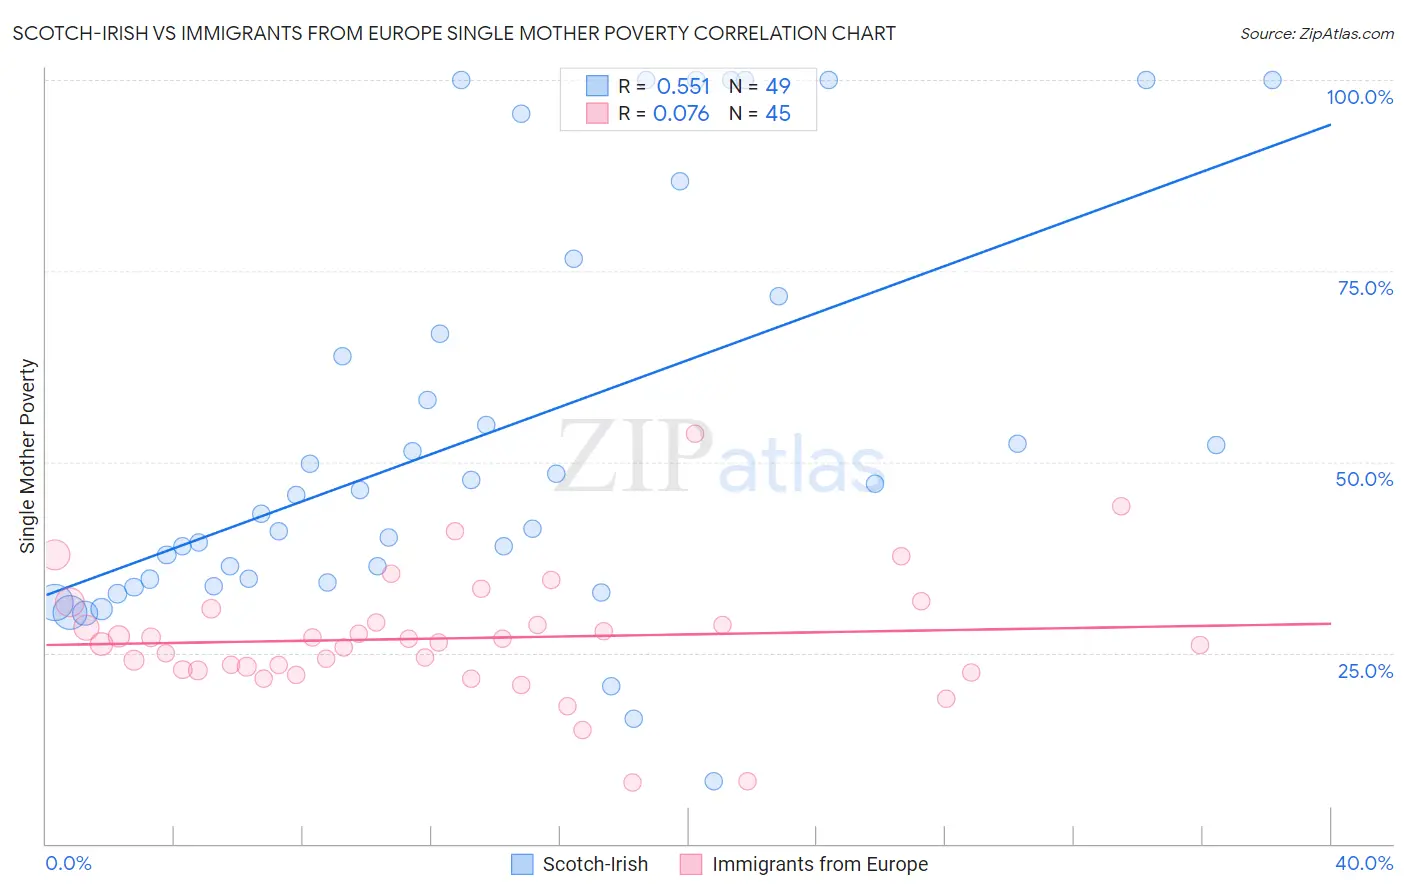
Scotch-Irish vs Immigrants from Europe Single Mother Poverty Correlation Chart
The statistical analysis conducted on geographies consisting of 524,083,922 people shows a substantial positive correlation between the proportion of Scotch-Irish and poverty level among single mothers in the United States with a correlation coefficient (R) of 0.551 and weighted average of 31.5%. Similarly, the statistical analysis conducted on geographies consisting of 523,370,699 people shows a slight positive correlation between the proportion of Immigrants from Europe and poverty level among single mothers in the United States with a correlation coefficient (R) of 0.076 and weighted average of 27.4%, a difference of 14.7%.
Single Mother Poverty Correlation Summary
| Measurement | Scotch-Irish | Immigrants from Europe |
| Minimum | 8.1% | 8.0% |
| Maximum | 100.0% | 53.7% |
| Range | 91.9% | 45.6% |
| Mean | 53.3% | 26.9% |
| Median | 45.6% | 26.4% |
| Interquartile 25% (IQ1) | 34.5% | 22.8% |
| Interquartile 75% (IQ3) | 69.2% | 29.9% |
| Interquartile Range (IQR) | 34.7% | 7.1% |
| Standard Deviation (Sample) | 26.2% | 8.2% |
| Standard Deviation (Population) | 25.9% | 8.1% |
Similar Demographics by Single Mother Poverty
Demographics Similar to Scotch-Irish by Single Mother Poverty
In terms of single mother poverty, the demographic groups most similar to Scotch-Irish are Immigrants from Senegal (31.5%, a difference of 0.040%), British West Indian (31.5%, a difference of 0.050%), Immigrants from Belize (31.4%, a difference of 0.22%), Immigrants from Cabo Verde (31.6%, a difference of 0.29%), and Immigrants from Micronesia (31.6%, a difference of 0.30%).
| Demographics | Rating | Rank | Single Mother Poverty |
| Hmong | 0.3 /100 | #262 | Tragic 31.2% |
| Bahamians | 0.2 /100 | #263 | Tragic 31.3% |
| Immigrants | Ecuador | 0.2 /100 | #264 | Tragic 31.3% |
| German Russians | 0.2 /100 | #265 | Tragic 31.3% |
| Sub-Saharan Africans | 0.2 /100 | #266 | Tragic 31.4% |
| Immigrants | Belize | 0.2 /100 | #267 | Tragic 31.4% |
| Immigrants | Senegal | 0.1 /100 | #268 | Tragic 31.5% |
| Scotch-Irish | 0.1 /100 | #269 | Tragic 31.5% |
| British West Indians | 0.1 /100 | #270 | Tragic 31.5% |
| Immigrants | Cabo Verde | 0.1 /100 | #271 | Tragic 31.6% |
| Immigrants | Micronesia | 0.1 /100 | #272 | Tragic 31.6% |
| Fijians | 0.1 /100 | #273 | Tragic 31.6% |
| Bangladeshis | 0.1 /100 | #274 | Tragic 31.7% |
| Central Americans | 0.1 /100 | #275 | Tragic 31.8% |
| Delaware | 0.0 /100 | #276 | Tragic 31.8% |
Demographics Similar to Immigrants from Europe by Single Mother Poverty
In terms of single mother poverty, the demographic groups most similar to Immigrants from Europe are Sierra Leonean (27.4%, a difference of 0.060%), Immigrants from Russia (27.4%, a difference of 0.13%), Immigrants from Sweden (27.5%, a difference of 0.13%), Macedonian (27.4%, a difference of 0.15%), and Immigrants from Belarus (27.4%, a difference of 0.17%).
| Demographics | Rating | Rank | Single Mother Poverty |
| Immigrants | Australia | 99.5 /100 | #67 | Exceptional 27.3% |
| Immigrants | Czechoslovakia | 99.5 /100 | #68 | Exceptional 27.4% |
| Lithuanians | 99.4 /100 | #69 | Exceptional 27.4% |
| Immigrants | Belarus | 99.4 /100 | #70 | Exceptional 27.4% |
| Macedonians | 99.4 /100 | #71 | Exceptional 27.4% |
| Immigrants | Russia | 99.4 /100 | #72 | Exceptional 27.4% |
| Sierra Leoneans | 99.3 /100 | #73 | Exceptional 27.4% |
| Immigrants | Europe | 99.3 /100 | #74 | Exceptional 27.4% |
| Immigrants | Sweden | 99.2 /100 | #75 | Exceptional 27.5% |
| Peruvians | 99.2 /100 | #76 | Exceptional 27.5% |
| Immigrants | Peru | 99.2 /100 | #77 | Exceptional 27.5% |
| Immigrants | North Macedonia | 99.2 /100 | #78 | Exceptional 27.5% |
| Immigrants | Italy | 99.1 /100 | #79 | Exceptional 27.5% |
| Taiwanese | 99.1 /100 | #80 | Exceptional 27.5% |
| Immigrants | Scotland | 98.9 /100 | #81 | Exceptional 27.6% |