Houma vs Chickasaw Unemployment Among Women with Children Under 18 years
COMPARE
Houma
Chickasaw
Unemployment Among Women with Children Under 18 years
Unemployment Among Women with Children Under 18 years Comparison
Houma
Chickasaw
6.8%
UNEMPLOYMENT AMONG WOMEN WITH CHILDREN UNDER 18 YEARS
0.0/ 100
METRIC RATING
322nd/ 347
METRIC RANK
5.4%
UNEMPLOYMENT AMONG WOMEN WITH CHILDREN UNDER 18 YEARS
68.4/ 100
METRIC RATING
159th/ 347
METRIC RANK
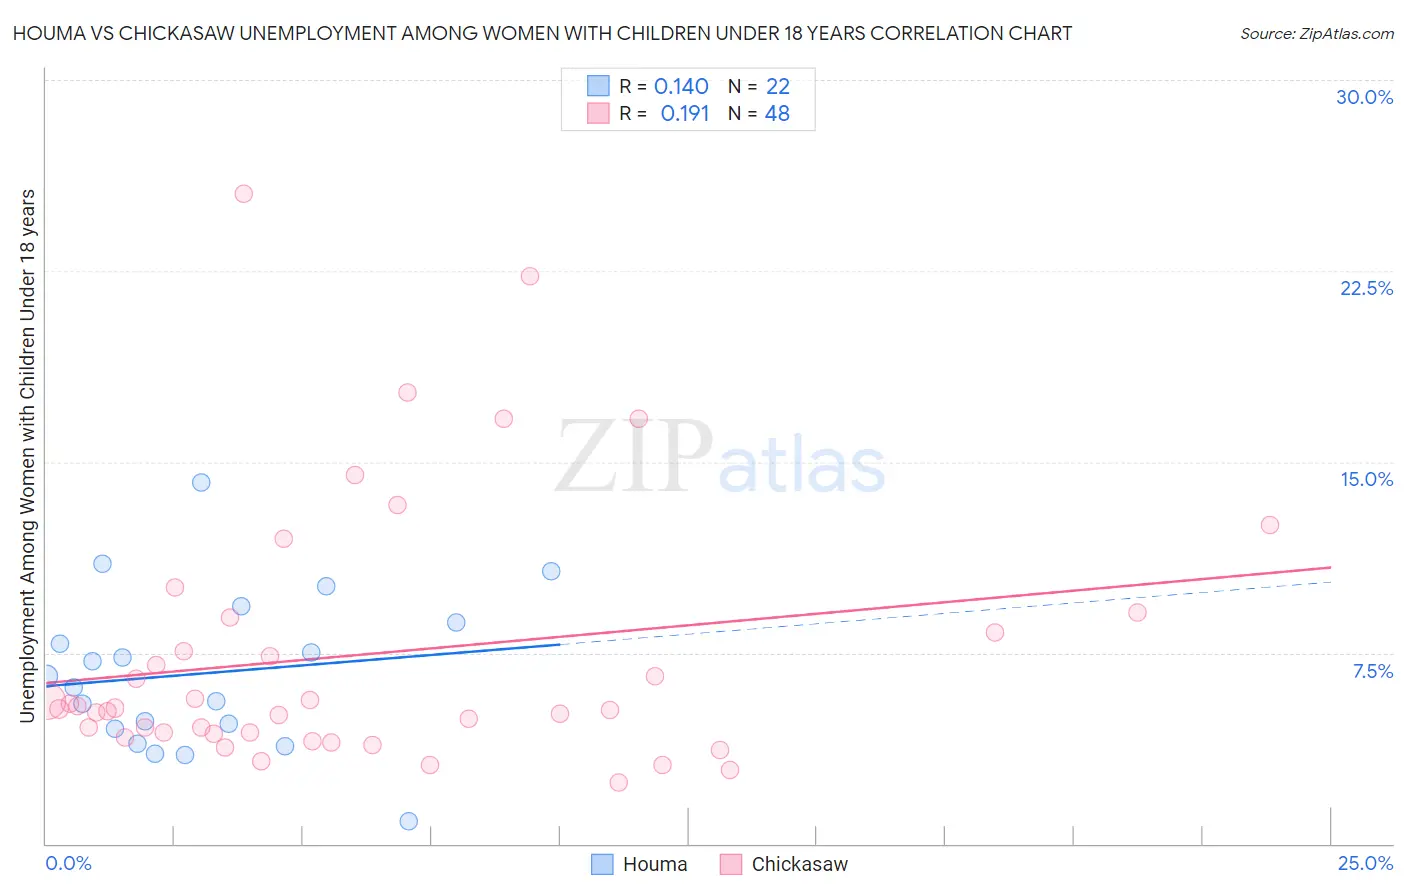
Houma vs Chickasaw Unemployment Among Women with Children Under 18 years Correlation Chart
The statistical analysis conducted on geographies consisting of 36,457,535 people shows a poor positive correlation between the proportion of Houma and unemployment rate among women with children under the age of 18 in the United States with a correlation coefficient (R) of 0.140 and weighted average of 6.8%. Similarly, the statistical analysis conducted on geographies consisting of 144,879,711 people shows a poor positive correlation between the proportion of Chickasaw and unemployment rate among women with children under the age of 18 in the United States with a correlation coefficient (R) of 0.191 and weighted average of 5.4%, a difference of 26.8%.
Unemployment Among Women with Children Under 18 years Correlation Summary
| Measurement | Houma | Chickasaw |
| Minimum | 0.90% | 2.4% |
| Maximum | 14.2% | 25.5% |
| Range | 13.3% | 23.1% |
| Mean | 6.7% | 7.4% |
| Median | 6.4% | 5.3% |
| Interquartile 25% (IQ1) | 4.5% | 4.3% |
| Interquartile 75% (IQ3) | 8.7% | 8.6% |
| Interquartile Range (IQR) | 4.2% | 4.3% |
| Standard Deviation (Sample) | 3.1% | 5.2% |
| Standard Deviation (Population) | 3.0% | 5.1% |
Similar Demographics by Unemployment Among Women with Children Under 18 years
Demographics Similar to Houma by Unemployment Among Women with Children Under 18 years
In terms of unemployment among women with children under 18 years, the demographic groups most similar to Houma are Pueblo (6.8%, a difference of 0.19%), Paiute (6.9%, a difference of 1.1%), U.S. Virgin Islander (6.7%, a difference of 2.0%), Immigrants from Belize (6.7%, a difference of 2.0%), and Central American Indian (6.7%, a difference of 2.1%).
| Demographics | Rating | Rank | Unemployment Among Women with Children Under 18 years |
| Immigrants | West Indies | 0.0 /100 | #315 | Tragic 6.6% |
| Immigrants | Ecuador | 0.0 /100 | #316 | Tragic 6.6% |
| Shoshone | 0.0 /100 | #317 | Tragic 6.6% |
| Alaska Natives | 0.0 /100 | #318 | Tragic 6.7% |
| Central American Indians | 0.0 /100 | #319 | Tragic 6.7% |
| Immigrants | Belize | 0.0 /100 | #320 | Tragic 6.7% |
| U.S. Virgin Islanders | 0.0 /100 | #321 | Tragic 6.7% |
| Houma | 0.0 /100 | #322 | Tragic 6.8% |
| Pueblo | 0.0 /100 | #323 | Tragic 6.8% |
| Paiute | 0.0 /100 | #324 | Tragic 6.9% |
| Immigrants | Dominica | 0.0 /100 | #325 | Tragic 7.0% |
| Chippewa | 0.0 /100 | #326 | Tragic 7.0% |
| Lumbee | 0.0 /100 | #327 | Tragic 7.1% |
| Natives/Alaskans | 0.0 /100 | #328 | Tragic 7.2% |
| Blacks/African Americans | 0.0 /100 | #329 | Tragic 7.3% |
Demographics Similar to Chickasaw by Unemployment Among Women with Children Under 18 years
In terms of unemployment among women with children under 18 years, the demographic groups most similar to Chickasaw are Immigrants from Burma/Myanmar (5.4%, a difference of 0.090%), German Russian (5.4%, a difference of 0.15%), Afghan (5.4%, a difference of 0.15%), South African (5.4%, a difference of 0.16%), and Korean (5.4%, a difference of 0.18%).
| Demographics | Rating | Rank | Unemployment Among Women with Children Under 18 years |
| Immigrants | South Eastern Asia | 71.1 /100 | #152 | Good 5.4% |
| Carpatho Rusyns | 70.8 /100 | #153 | Good 5.4% |
| Immigrants | Latvia | 70.8 /100 | #154 | Good 5.4% |
| Koreans | 70.5 /100 | #155 | Good 5.4% |
| South Africans | 70.3 /100 | #156 | Good 5.4% |
| German Russians | 70.2 /100 | #157 | Good 5.4% |
| Immigrants | Burma/Myanmar | 69.5 /100 | #158 | Good 5.4% |
| Chickasaw | 68.4 /100 | #159 | Good 5.4% |
| Afghans | 66.6 /100 | #160 | Good 5.4% |
| Immigrants | Iraq | 65.9 /100 | #161 | Good 5.4% |
| Immigrants | Saudi Arabia | 65.0 /100 | #162 | Good 5.4% |
| Lebanese | 64.7 /100 | #163 | Good 5.4% |
| Celtics | 63.0 /100 | #164 | Good 5.4% |
| Tlingit-Haida | 61.9 /100 | #165 | Good 5.4% |
| Aleuts | 59.4 /100 | #166 | Average 5.4% |