Honduran vs Apache Single Male Poverty
COMPARE
Honduran
Apache
Single Male Poverty
Single Male Poverty Comparison
Hondurans
Apache
14.0%
SINGLE MALE POVERTY
0.1/ 100
METRIC RATING
274th/ 347
METRIC RANK
21.6%
SINGLE MALE POVERTY
0.0/ 100
METRIC RATING
337th/ 347
METRIC RANK
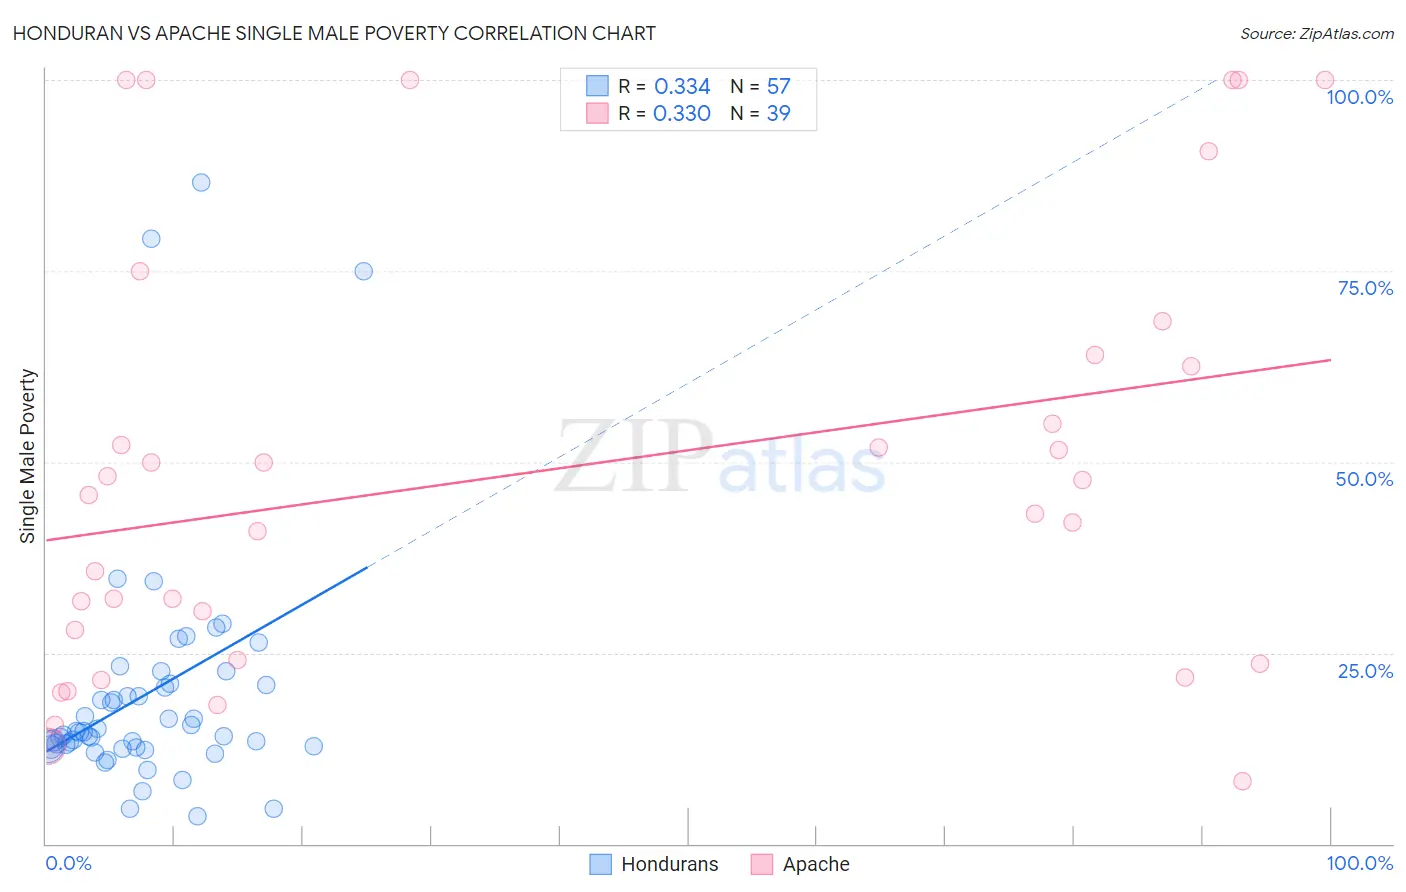
Honduran vs Apache Single Male Poverty Correlation Chart
The statistical analysis conducted on geographies consisting of 327,718,119 people shows a mild positive correlation between the proportion of Hondurans and poverty level among single males in the United States with a correlation coefficient (R) of 0.334 and weighted average of 14.0%. Similarly, the statistical analysis conducted on geographies consisting of 216,687,885 people shows a mild positive correlation between the proportion of Apache and poverty level among single males in the United States with a correlation coefficient (R) of 0.330 and weighted average of 21.6%, a difference of 53.5%.
Single Male Poverty Correlation Summary
| Measurement | Honduran | Apache |
| Minimum | 3.6% | 8.2% |
| Maximum | 86.6% | 100.0% |
| Range | 83.0% | 91.8% |
| Mean | 19.6% | 49.1% |
| Median | 14.6% | 45.6% |
| Interquartile 25% (IQ1) | 12.7% | 24.1% |
| Interquartile 75% (IQ3) | 20.9% | 64.0% |
| Interquartile Range (IQR) | 8.2% | 39.9% |
| Standard Deviation (Sample) | 15.9% | 28.3% |
| Standard Deviation (Population) | 15.8% | 27.9% |
Similar Demographics by Single Male Poverty
Demographics Similar to Hondurans by Single Male Poverty
In terms of single male poverty, the demographic groups most similar to Hondurans are English (14.1%, a difference of 0.080%), Welsh (14.0%, a difference of 0.13%), Dutch (14.1%, a difference of 0.19%), Immigrants from Honduras (14.1%, a difference of 0.23%), and Slovak (14.1%, a difference of 0.30%).
| Demographics | Rating | Rank | Single Male Poverty |
| Germans | 0.1 /100 | #267 | Tragic 13.9% |
| Immigrants | Mexico | 0.1 /100 | #268 | Tragic 13.9% |
| Scottish | 0.1 /100 | #269 | Tragic 14.0% |
| Immigrants | Saudi Arabia | 0.1 /100 | #270 | Tragic 14.0% |
| Irish | 0.1 /100 | #271 | Tragic 14.0% |
| Mexicans | 0.1 /100 | #272 | Tragic 14.0% |
| Welsh | 0.1 /100 | #273 | Tragic 14.0% |
| Hondurans | 0.1 /100 | #274 | Tragic 14.0% |
| English | 0.1 /100 | #275 | Tragic 14.1% |
| Dutch | 0.1 /100 | #276 | Tragic 14.1% |
| Immigrants | Honduras | 0.0 /100 | #277 | Tragic 14.1% |
| Slovaks | 0.0 /100 | #278 | Tragic 14.1% |
| Indonesians | 0.0 /100 | #279 | Tragic 14.1% |
| Hmong | 0.0 /100 | #280 | Tragic 14.2% |
| Hispanics or Latinos | 0.0 /100 | #281 | Tragic 14.2% |
Demographics Similar to Apache by Single Male Poverty
In terms of single male poverty, the demographic groups most similar to Apache are Tohono O'odham (21.6%, a difference of 0.10%), Pueblo (21.6%, a difference of 0.18%), Yuman (21.3%, a difference of 1.3%), Arapaho (21.9%, a difference of 1.7%), and Sioux (22.2%, a difference of 2.9%).
| Demographics | Rating | Rank | Single Male Poverty |
| Cajuns | 0.0 /100 | #330 | Tragic 19.1% |
| Paiute | 0.0 /100 | #331 | Tragic 19.3% |
| Natives/Alaskans | 0.0 /100 | #332 | Tragic 19.6% |
| Inupiat | 0.0 /100 | #333 | Tragic 20.0% |
| Pima | 0.0 /100 | #334 | Tragic 20.2% |
| Yuman | 0.0 /100 | #335 | Tragic 21.3% |
| Tohono O'odham | 0.0 /100 | #336 | Tragic 21.6% |
| Apache | 0.0 /100 | #337 | Tragic 21.6% |
| Pueblo | 0.0 /100 | #338 | Tragic 21.6% |
| Arapaho | 0.0 /100 | #339 | Tragic 21.9% |
| Sioux | 0.0 /100 | #340 | Tragic 22.2% |
| Crow | 0.0 /100 | #341 | Tragic 23.3% |
| Houma | 0.0 /100 | #342 | Tragic 23.5% |
| Puerto Ricans | 0.0 /100 | #343 | Tragic 25.1% |
| Lumbee | 0.0 /100 | #344 | Tragic 25.2% |