Hungarian vs Apache Single Male Poverty
COMPARE
Hungarian
Apache
Single Male Poverty
Single Male Poverty Comparison
Hungarians
Apache
13.8%
SINGLE MALE POVERTY
0.3/ 100
METRIC RATING
261st/ 347
METRIC RANK
21.6%
SINGLE MALE POVERTY
0.0/ 100
METRIC RATING
337th/ 347
METRIC RANK
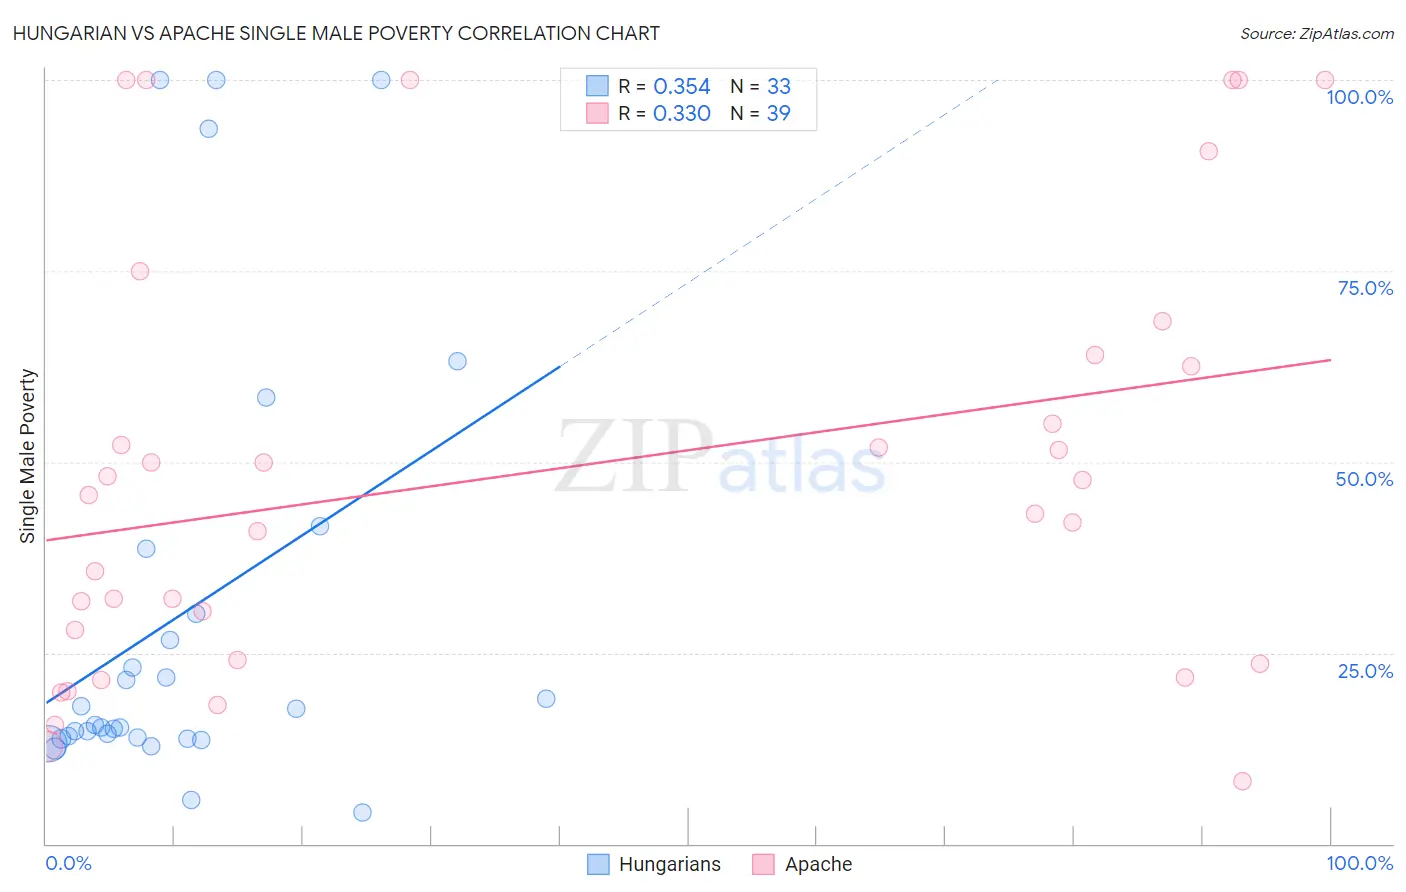
Hungarian vs Apache Single Male Poverty Correlation Chart
The statistical analysis conducted on geographies consisting of 413,693,148 people shows a mild positive correlation between the proportion of Hungarians and poverty level among single males in the United States with a correlation coefficient (R) of 0.354 and weighted average of 13.8%. Similarly, the statistical analysis conducted on geographies consisting of 216,687,885 people shows a mild positive correlation between the proportion of Apache and poverty level among single males in the United States with a correlation coefficient (R) of 0.330 and weighted average of 21.6%, a difference of 56.5%.
Single Male Poverty Correlation Summary
| Measurement | Hungarian | Apache |
| Minimum | 4.0% | 8.2% |
| Maximum | 100.0% | 100.0% |
| Range | 96.0% | 91.8% |
| Mean | 30.2% | 49.1% |
| Median | 15.5% | 45.6% |
| Interquartile 25% (IQ1) | 13.9% | 24.1% |
| Interquartile 75% (IQ3) | 34.3% | 64.0% |
| Interquartile Range (IQR) | 20.5% | 39.9% |
| Standard Deviation (Sample) | 28.8% | 28.3% |
| Standard Deviation (Population) | 28.4% | 27.9% |
Similar Demographics by Single Male Poverty
Demographics Similar to Hungarians by Single Male Poverty
In terms of single male poverty, the demographic groups most similar to Hungarians are Swiss (13.8%, a difference of 0.050%), Guatemalan (13.8%, a difference of 0.12%), Immigrants from Guatemala (13.8%, a difference of 0.16%), Fijian (13.8%, a difference of 0.17%), and Immigrants from Central America (13.8%, a difference of 0.23%).
| Demographics | Rating | Rank | Single Male Poverty |
| Sub-Saharan Africans | 0.5 /100 | #254 | Tragic 13.7% |
| Spaniards | 0.4 /100 | #255 | Tragic 13.7% |
| Immigrants | Belize | 0.4 /100 | #256 | Tragic 13.7% |
| Immigrants | Central America | 0.3 /100 | #257 | Tragic 13.8% |
| Immigrants | Guatemala | 0.3 /100 | #258 | Tragic 13.8% |
| Guatemalans | 0.3 /100 | #259 | Tragic 13.8% |
| Swiss | 0.3 /100 | #260 | Tragic 13.8% |
| Hungarians | 0.3 /100 | #261 | Tragic 13.8% |
| Fijians | 0.3 /100 | #262 | Tragic 13.8% |
| Cape Verdeans | 0.2 /100 | #263 | Tragic 13.8% |
| West Indians | 0.2 /100 | #264 | Tragic 13.8% |
| Immigrants | Congo | 0.2 /100 | #265 | Tragic 13.9% |
| Immigrants | Cabo Verde | 0.1 /100 | #266 | Tragic 13.9% |
| Germans | 0.1 /100 | #267 | Tragic 13.9% |
| Immigrants | Mexico | 0.1 /100 | #268 | Tragic 13.9% |
Demographics Similar to Apache by Single Male Poverty
In terms of single male poverty, the demographic groups most similar to Apache are Tohono O'odham (21.6%, a difference of 0.10%), Pueblo (21.6%, a difference of 0.18%), Yuman (21.3%, a difference of 1.3%), Arapaho (21.9%, a difference of 1.7%), and Sioux (22.2%, a difference of 2.9%).
| Demographics | Rating | Rank | Single Male Poverty |
| Cajuns | 0.0 /100 | #330 | Tragic 19.1% |
| Paiute | 0.0 /100 | #331 | Tragic 19.3% |
| Natives/Alaskans | 0.0 /100 | #332 | Tragic 19.6% |
| Inupiat | 0.0 /100 | #333 | Tragic 20.0% |
| Pima | 0.0 /100 | #334 | Tragic 20.2% |
| Yuman | 0.0 /100 | #335 | Tragic 21.3% |
| Tohono O'odham | 0.0 /100 | #336 | Tragic 21.6% |
| Apache | 0.0 /100 | #337 | Tragic 21.6% |
| Pueblo | 0.0 /100 | #338 | Tragic 21.6% |
| Arapaho | 0.0 /100 | #339 | Tragic 21.9% |
| Sioux | 0.0 /100 | #340 | Tragic 22.2% |
| Crow | 0.0 /100 | #341 | Tragic 23.3% |
| Houma | 0.0 /100 | #342 | Tragic 23.5% |
| Puerto Ricans | 0.0 /100 | #343 | Tragic 25.1% |
| Lumbee | 0.0 /100 | #344 | Tragic 25.2% |