Honduran vs Apache College, 1 year or more
COMPARE
Honduran
Apache
College, 1 year or more
College, 1 year or more Comparison
Hondurans
Apache
51.6%
COLLEGE, 1 YEAR OR MORE
0.0/ 100
METRIC RATING
310th/ 347
METRIC RANK
51.8%
COLLEGE, 1 YEAR OR MORE
0.0/ 100
METRIC RATING
309th/ 347
METRIC RANK
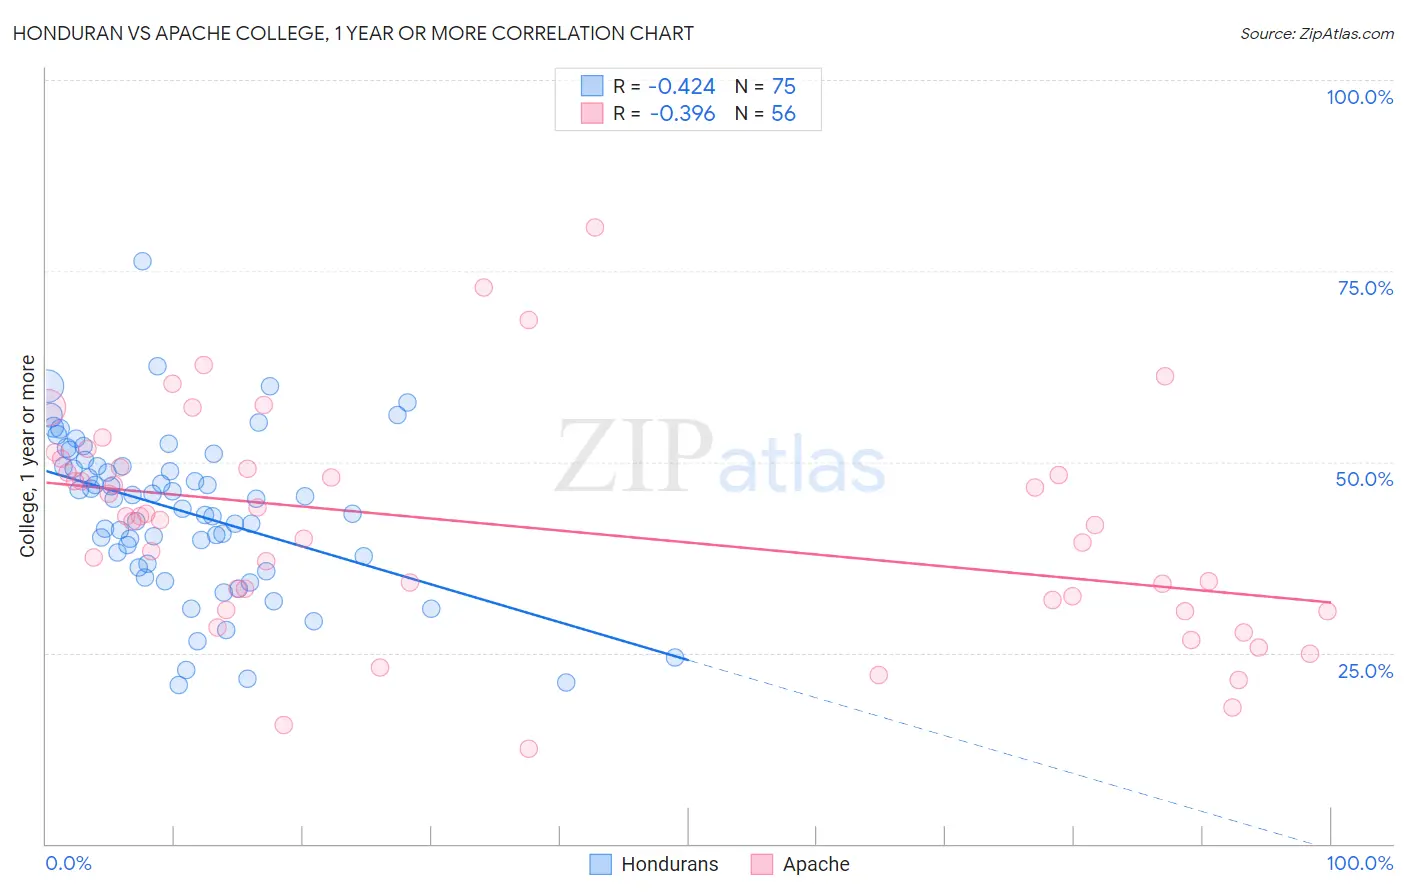
Honduran vs Apache College, 1 year or more Correlation Chart
The statistical analysis conducted on geographies consisting of 357,855,848 people shows a moderate negative correlation between the proportion of Hondurans and percentage of population with at least college, 1 year or more education in the United States with a correlation coefficient (R) of -0.424 and weighted average of 51.6%. Similarly, the statistical analysis conducted on geographies consisting of 231,142,948 people shows a mild negative correlation between the proportion of Apache and percentage of population with at least college, 1 year or more education in the United States with a correlation coefficient (R) of -0.396 and weighted average of 51.8%, a difference of 0.39%.
College, 1 year or more Correlation Summary
| Measurement | Honduran | Apache |
| Minimum | 20.7% | 12.5% |
| Maximum | 76.3% | 80.6% |
| Range | 55.6% | 68.1% |
| Mean | 43.4% | 41.5% |
| Median | 45.1% | 42.4% |
| Interquartile 25% (IQ1) | 36.7% | 31.2% |
| Interquartile 75% (IQ3) | 49.5% | 49.2% |
| Interquartile Range (IQR) | 12.8% | 18.0% |
| Standard Deviation (Sample) | 10.4% | 14.3% |
| Standard Deviation (Population) | 10.4% | 14.1% |
Demographics Similar to Hondurans and Apache by College, 1 year or more
In terms of college, 1 year or more, the demographic groups most similar to Hondurans are Immigrants from Haiti (51.5%, a difference of 0.16%), Pueblo (51.5%, a difference of 0.20%), Immigrants from Caribbean (51.4%, a difference of 0.33%), Salvadoran (51.8%, a difference of 0.40%), and Immigrants from Portugal (51.9%, a difference of 0.50%). Similarly, the demographic groups most similar to Apache are Salvadoran (51.8%, a difference of 0.010%), Immigrants from Portugal (51.9%, a difference of 0.11%), Mexican American Indian (51.9%, a difference of 0.22%), Seminole (52.1%, a difference of 0.55%), and Immigrants from Haiti (51.5%, a difference of 0.55%).
| Demographics | Rating | Rank | College, 1 year or more |
| Immigrants | Nicaragua | 0.0 /100 | #299 | Tragic 52.4% |
| Choctaw | 0.0 /100 | #300 | Tragic 52.3% |
| Haitians | 0.0 /100 | #301 | Tragic 52.3% |
| Puerto Ricans | 0.0 /100 | #302 | Tragic 52.2% |
| Creek | 0.0 /100 | #303 | Tragic 52.2% |
| Central Americans | 0.0 /100 | #304 | Tragic 52.1% |
| Seminole | 0.0 /100 | #305 | Tragic 52.1% |
| Mexican American Indians | 0.0 /100 | #306 | Tragic 51.9% |
| Immigrants | Portugal | 0.0 /100 | #307 | Tragic 51.9% |
| Salvadorans | 0.0 /100 | #308 | Tragic 51.8% |
| Apache | 0.0 /100 | #309 | Tragic 51.8% |
| Hondurans | 0.0 /100 | #310 | Tragic 51.6% |
| Immigrants | Haiti | 0.0 /100 | #311 | Tragic 51.5% |
| Pueblo | 0.0 /100 | #312 | Tragic 51.5% |
| Immigrants | Caribbean | 0.0 /100 | #313 | Tragic 51.4% |
| Fijians | 0.0 /100 | #314 | Tragic 51.3% |
| Guatemalans | 0.0 /100 | #315 | Tragic 51.2% |
| Cajuns | 0.0 /100 | #316 | Tragic 51.2% |
| Hispanics or Latinos | 0.0 /100 | #317 | Tragic 51.1% |
| Immigrants | Honduras | 0.0 /100 | #318 | Tragic 51.0% |
| Immigrants | El Salvador | 0.0 /100 | #319 | Tragic 51.0% |