Immigrants from Turkey vs Apache Single Male Poverty
COMPARE
Immigrants from Turkey
Apache
Single Male Poverty
Single Male Poverty Comparison
Immigrants from Turkey
Apache
12.1%
SINGLE MALE POVERTY
98.2/ 100
METRIC RATING
91st/ 347
METRIC RANK
21.6%
SINGLE MALE POVERTY
0.0/ 100
METRIC RATING
337th/ 347
METRIC RANK
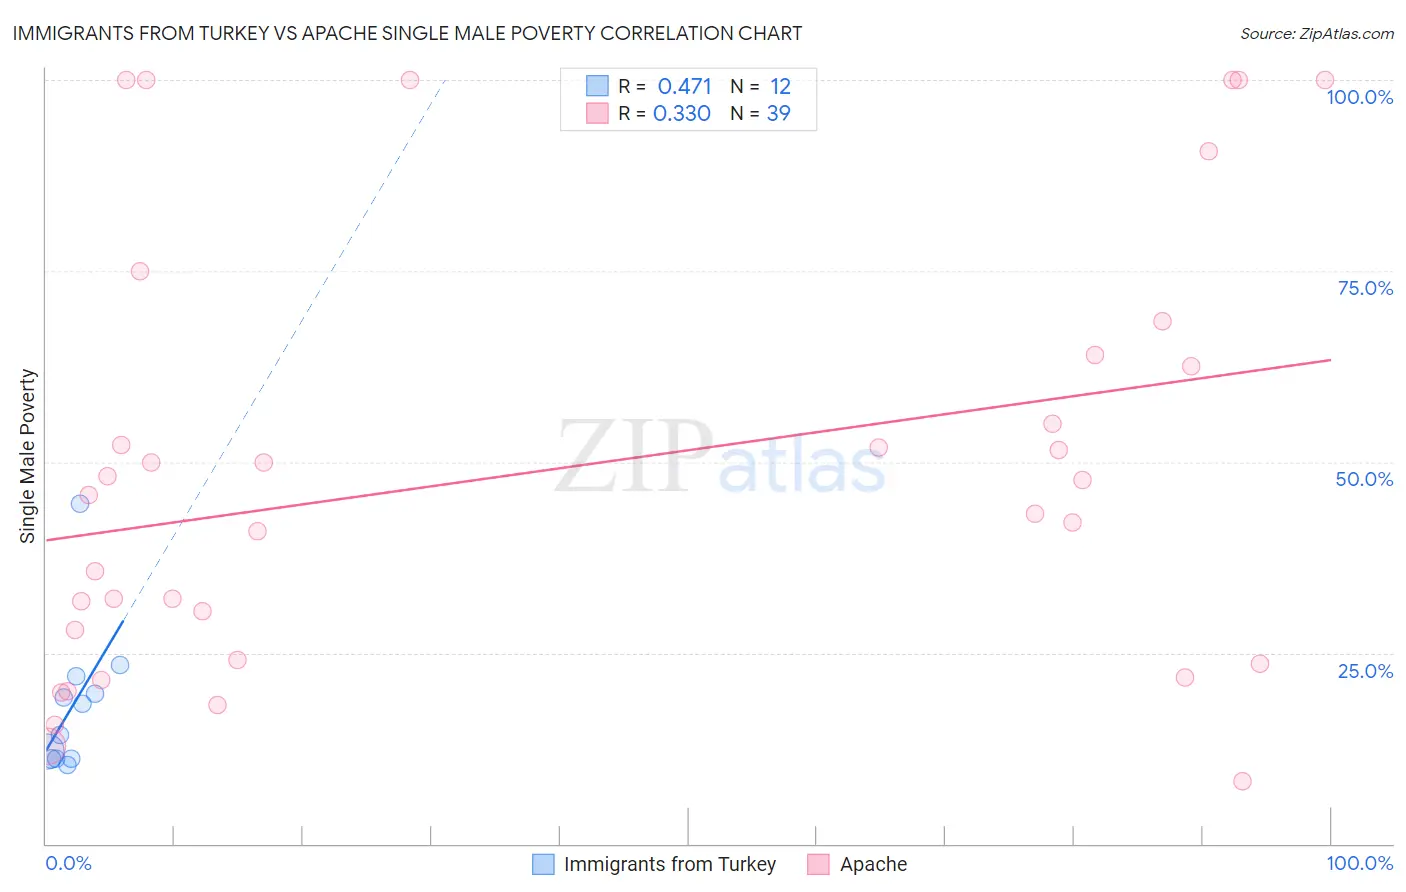
Immigrants from Turkey vs Apache Single Male Poverty Correlation Chart
The statistical analysis conducted on geographies consisting of 203,227,813 people shows a moderate positive correlation between the proportion of Immigrants from Turkey and poverty level among single males in the United States with a correlation coefficient (R) of 0.471 and weighted average of 12.1%. Similarly, the statistical analysis conducted on geographies consisting of 216,687,885 people shows a mild positive correlation between the proportion of Apache and poverty level among single males in the United States with a correlation coefficient (R) of 0.330 and weighted average of 21.6%, a difference of 77.9%.
Single Male Poverty Correlation Summary
| Measurement | Immigrants from Turkey | Apache |
| Minimum | 10.3% | 8.2% |
| Maximum | 44.5% | 100.0% |
| Range | 34.2% | 91.8% |
| Mean | 18.1% | 49.1% |
| Median | 16.2% | 45.6% |
| Interquartile 25% (IQ1) | 11.1% | 24.1% |
| Interquartile 75% (IQ3) | 20.8% | 64.0% |
| Interquartile Range (IQR) | 9.6% | 39.9% |
| Standard Deviation (Sample) | 9.5% | 28.3% |
| Standard Deviation (Population) | 9.1% | 27.9% |
Similar Demographics by Single Male Poverty
Demographics Similar to Immigrants from Turkey by Single Male Poverty
In terms of single male poverty, the demographic groups most similar to Immigrants from Turkey are South American Indian (12.1%, a difference of 0.050%), Immigrants from Ireland (12.1%, a difference of 0.060%), Spanish American Indian (12.1%, a difference of 0.11%), Immigrants from Bosnia and Herzegovina (12.1%, a difference of 0.17%), and Immigrants from Eritrea (12.1%, a difference of 0.23%).
| Demographics | Rating | Rank | Single Male Poverty |
| Immigrants | Czechoslovakia | 98.6 /100 | #84 | Exceptional 12.1% |
| Turks | 98.5 /100 | #85 | Exceptional 12.1% |
| Immigrants | Israel | 98.5 /100 | #86 | Exceptional 12.1% |
| South Americans | 98.5 /100 | #87 | Exceptional 12.1% |
| Immigrants | Eritrea | 98.5 /100 | #88 | Exceptional 12.1% |
| Immigrants | Ireland | 98.3 /100 | #89 | Exceptional 12.1% |
| South American Indians | 98.3 /100 | #90 | Exceptional 12.1% |
| Immigrants | Turkey | 98.2 /100 | #91 | Exceptional 12.1% |
| Spanish American Indians | 98.0 /100 | #92 | Exceptional 12.1% |
| Immigrants | Bosnia and Herzegovina | 97.9 /100 | #93 | Exceptional 12.1% |
| Colombians | 97.8 /100 | #94 | Exceptional 12.2% |
| Mongolians | 97.7 /100 | #95 | Exceptional 12.2% |
| Immigrants | Sweden | 97.5 /100 | #96 | Exceptional 12.2% |
| Immigrants | Italy | 97.4 /100 | #97 | Exceptional 12.2% |
| Guamanians/Chamorros | 97.4 /100 | #98 | Exceptional 12.2% |
Demographics Similar to Apache by Single Male Poverty
In terms of single male poverty, the demographic groups most similar to Apache are Tohono O'odham (21.6%, a difference of 0.10%), Pueblo (21.6%, a difference of 0.18%), Yuman (21.3%, a difference of 1.3%), Arapaho (21.9%, a difference of 1.7%), and Sioux (22.2%, a difference of 2.9%).
| Demographics | Rating | Rank | Single Male Poverty |
| Cajuns | 0.0 /100 | #330 | Tragic 19.1% |
| Paiute | 0.0 /100 | #331 | Tragic 19.3% |
| Natives/Alaskans | 0.0 /100 | #332 | Tragic 19.6% |
| Inupiat | 0.0 /100 | #333 | Tragic 20.0% |
| Pima | 0.0 /100 | #334 | Tragic 20.2% |
| Yuman | 0.0 /100 | #335 | Tragic 21.3% |
| Tohono O'odham | 0.0 /100 | #336 | Tragic 21.6% |
| Apache | 0.0 /100 | #337 | Tragic 21.6% |
| Pueblo | 0.0 /100 | #338 | Tragic 21.6% |
| Arapaho | 0.0 /100 | #339 | Tragic 21.9% |
| Sioux | 0.0 /100 | #340 | Tragic 22.2% |
| Crow | 0.0 /100 | #341 | Tragic 23.3% |
| Houma | 0.0 /100 | #342 | Tragic 23.5% |
| Puerto Ricans | 0.0 /100 | #343 | Tragic 25.1% |
| Lumbee | 0.0 /100 | #344 | Tragic 25.2% |