Immigrants from England vs Apache Single Male Poverty
COMPARE
Immigrants from England
Apache
Single Male Poverty
Single Male Poverty Comparison
Immigrants from England
Apache
13.0%
SINGLE MALE POVERTY
23.4/ 100
METRIC RATING
195th/ 347
METRIC RANK
21.6%
SINGLE MALE POVERTY
0.0/ 100
METRIC RATING
337th/ 347
METRIC RANK
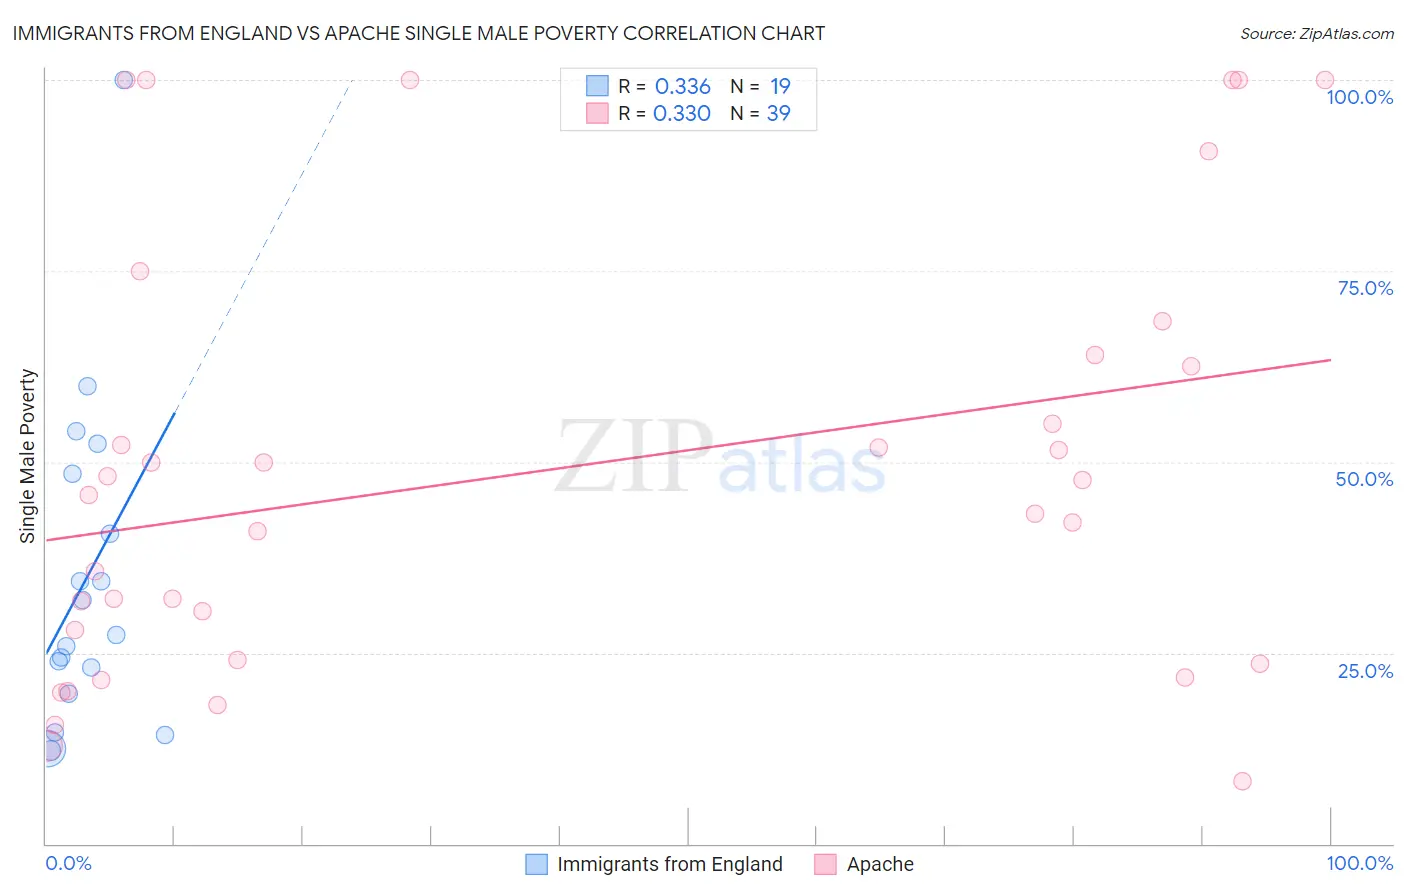
Immigrants from England vs Apache Single Male Poverty Correlation Chart
The statistical analysis conducted on geographies consisting of 343,807,729 people shows a mild positive correlation between the proportion of Immigrants from England and poverty level among single males in the United States with a correlation coefficient (R) of 0.336 and weighted average of 13.0%. Similarly, the statistical analysis conducted on geographies consisting of 216,687,885 people shows a mild positive correlation between the proportion of Apache and poverty level among single males in the United States with a correlation coefficient (R) of 0.330 and weighted average of 21.6%, a difference of 66.0%.
Single Male Poverty Correlation Summary
| Measurement | Immigrants from England | Apache |
| Minimum | 12.2% | 8.2% |
| Maximum | 100.0% | 100.0% |
| Range | 87.8% | 91.8% |
| Mean | 34.4% | 49.1% |
| Median | 27.3% | 45.6% |
| Interquartile 25% (IQ1) | 19.7% | 24.1% |
| Interquartile 75% (IQ3) | 48.4% | 64.0% |
| Interquartile Range (IQR) | 28.8% | 39.9% |
| Standard Deviation (Sample) | 21.5% | 28.3% |
| Standard Deviation (Population) | 21.0% | 27.9% |
Similar Demographics by Single Male Poverty
Demographics Similar to Immigrants from England by Single Male Poverty
In terms of single male poverty, the demographic groups most similar to Immigrants from England are Immigrants from Grenada (13.0%, a difference of 0.020%), Immigrants from Laos (13.0%, a difference of 0.020%), Lithuanian (13.0%, a difference of 0.090%), Immigrants from Norway (13.0%, a difference of 0.12%), and Liberian (13.0%, a difference of 0.13%).
| Demographics | Rating | Rank | Single Male Poverty |
| Macedonians | 31.5 /100 | #188 | Fair 12.9% |
| Portuguese | 30.2 /100 | #189 | Fair 12.9% |
| Arabs | 27.0 /100 | #190 | Fair 13.0% |
| Immigrants | Thailand | 26.6 /100 | #191 | Fair 13.0% |
| Immigrants | Jamaica | 26.5 /100 | #192 | Fair 13.0% |
| Immigrants | South Africa | 26.1 /100 | #193 | Fair 13.0% |
| Liberians | 25.2 /100 | #194 | Fair 13.0% |
| Immigrants | England | 23.4 /100 | #195 | Fair 13.0% |
| Immigrants | Grenada | 23.1 /100 | #196 | Fair 13.0% |
| Immigrants | Laos | 23.1 /100 | #197 | Fair 13.0% |
| Lithuanians | 22.1 /100 | #198 | Fair 13.0% |
| Immigrants | Norway | 21.8 /100 | #199 | Fair 13.0% |
| Slovenes | 21.6 /100 | #200 | Fair 13.0% |
| Trinidadians and Tobagonians | 21.4 /100 | #201 | Fair 13.0% |
| Basques | 20.7 /100 | #202 | Fair 13.0% |
Demographics Similar to Apache by Single Male Poverty
In terms of single male poverty, the demographic groups most similar to Apache are Tohono O'odham (21.6%, a difference of 0.10%), Pueblo (21.6%, a difference of 0.18%), Yuman (21.3%, a difference of 1.3%), Arapaho (21.9%, a difference of 1.7%), and Sioux (22.2%, a difference of 2.9%).
| Demographics | Rating | Rank | Single Male Poverty |
| Cajuns | 0.0 /100 | #330 | Tragic 19.1% |
| Paiute | 0.0 /100 | #331 | Tragic 19.3% |
| Natives/Alaskans | 0.0 /100 | #332 | Tragic 19.6% |
| Inupiat | 0.0 /100 | #333 | Tragic 20.0% |
| Pima | 0.0 /100 | #334 | Tragic 20.2% |
| Yuman | 0.0 /100 | #335 | Tragic 21.3% |
| Tohono O'odham | 0.0 /100 | #336 | Tragic 21.6% |
| Apache | 0.0 /100 | #337 | Tragic 21.6% |
| Pueblo | 0.0 /100 | #338 | Tragic 21.6% |
| Arapaho | 0.0 /100 | #339 | Tragic 21.9% |
| Sioux | 0.0 /100 | #340 | Tragic 22.2% |
| Crow | 0.0 /100 | #341 | Tragic 23.3% |
| Houma | 0.0 /100 | #342 | Tragic 23.5% |
| Puerto Ricans | 0.0 /100 | #343 | Tragic 25.1% |
| Lumbee | 0.0 /100 | #344 | Tragic 25.2% |