Czech vs Apache Single Male Poverty
COMPARE
Czech
Apache
Single Male Poverty
Single Male Poverty Comparison
Czechs
Apache
13.5%
SINGLE MALE POVERTY
1.2/ 100
METRIC RATING
248th/ 347
METRIC RANK
21.6%
SINGLE MALE POVERTY
0.0/ 100
METRIC RATING
337th/ 347
METRIC RANK
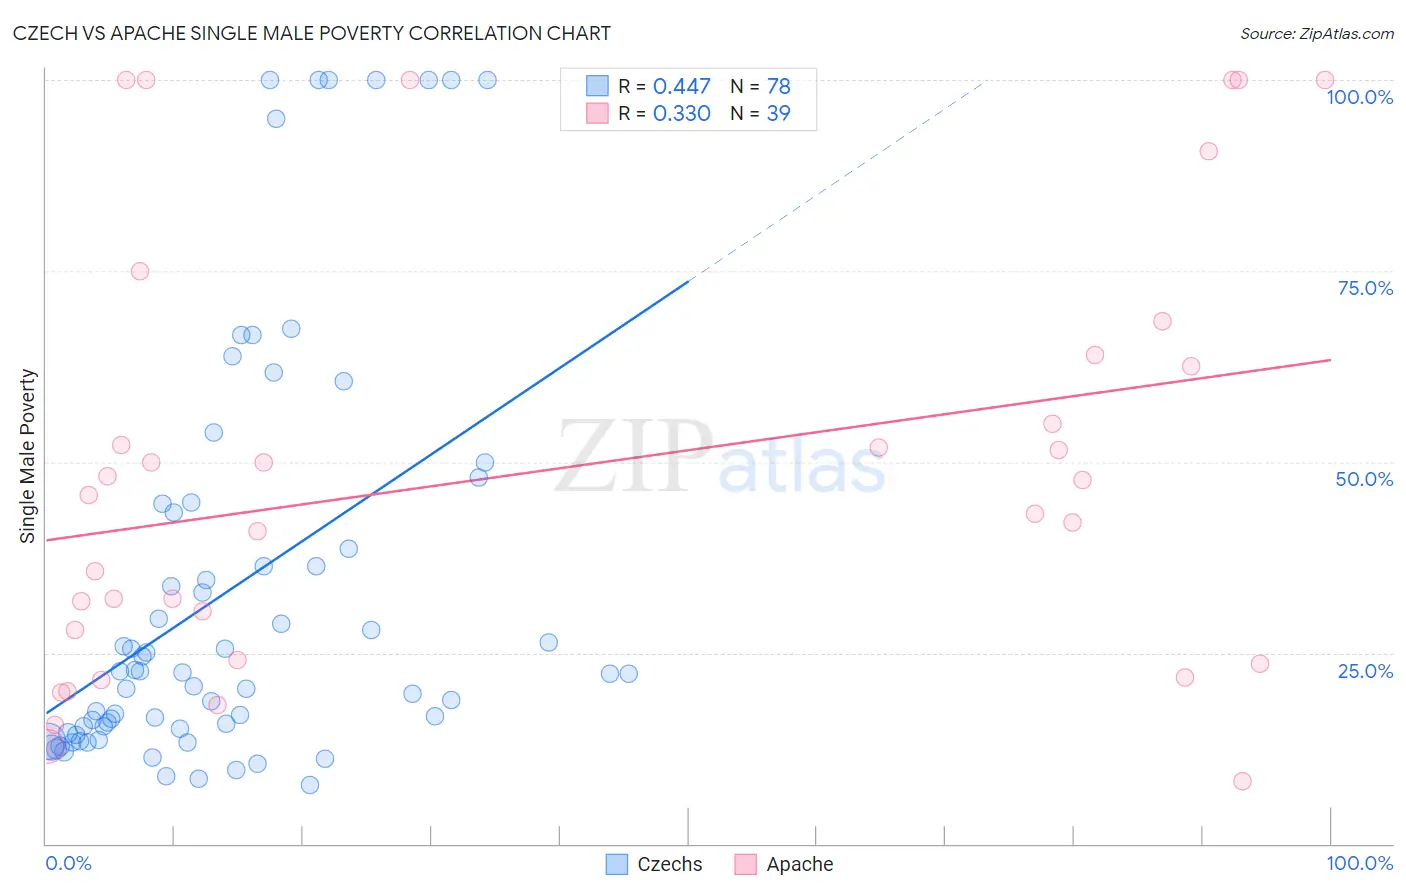
Czech vs Apache Single Male Poverty Correlation Chart
The statistical analysis conducted on geographies consisting of 410,747,171 people shows a moderate positive correlation between the proportion of Czechs and poverty level among single males in the United States with a correlation coefficient (R) of 0.447 and weighted average of 13.5%. Similarly, the statistical analysis conducted on geographies consisting of 216,687,885 people shows a mild positive correlation between the proportion of Apache and poverty level among single males in the United States with a correlation coefficient (R) of 0.330 and weighted average of 21.6%, a difference of 59.3%.
Single Male Poverty Correlation Summary
| Measurement | Czech | Apache |
| Minimum | 7.7% | 8.2% |
| Maximum | 100.0% | 100.0% |
| Range | 92.3% | 91.8% |
| Mean | 33.2% | 49.1% |
| Median | 22.4% | 45.6% |
| Interquartile 25% (IQ1) | 15.1% | 24.1% |
| Interquartile 75% (IQ3) | 43.3% | 64.0% |
| Interquartile Range (IQR) | 28.3% | 39.9% |
| Standard Deviation (Sample) | 27.1% | 28.3% |
| Standard Deviation (Population) | 26.9% | 27.9% |
Similar Demographics by Single Male Poverty
Demographics Similar to Czechs by Single Male Poverty
In terms of single male poverty, the demographic groups most similar to Czechs are Belgian (13.5%, a difference of 0.030%), Immigrants from Micronesia (13.5%, a difference of 0.040%), Immigrants from Latin America (13.5%, a difference of 0.14%), Spanish (13.6%, a difference of 0.24%), and Immigrants from Somalia (13.6%, a difference of 0.26%).
| Demographics | Rating | Rank | Single Male Poverty |
| Immigrants | Germany | 2.1 /100 | #241 | Tragic 13.4% |
| Carpatho Rusyns | 2.1 /100 | #242 | Tragic 13.4% |
| Barbadians | 2.1 /100 | #243 | Tragic 13.4% |
| Immigrants | Senegal | 1.7 /100 | #244 | Tragic 13.5% |
| Immigrants | Latin America | 1.3 /100 | #245 | Tragic 13.5% |
| Immigrants | Micronesia | 1.2 /100 | #246 | Tragic 13.5% |
| Belgians | 1.2 /100 | #247 | Tragic 13.5% |
| Czechs | 1.2 /100 | #248 | Tragic 13.5% |
| Spanish | 1.0 /100 | #249 | Tragic 13.6% |
| Immigrants | Somalia | 1.0 /100 | #250 | Tragic 13.6% |
| Immigrants | Zaire | 0.9 /100 | #251 | Tragic 13.6% |
| Finns | 0.9 /100 | #252 | Tragic 13.6% |
| German Russians | 0.8 /100 | #253 | Tragic 13.6% |
| Sub-Saharan Africans | 0.5 /100 | #254 | Tragic 13.7% |
| Spaniards | 0.4 /100 | #255 | Tragic 13.7% |
Demographics Similar to Apache by Single Male Poverty
In terms of single male poverty, the demographic groups most similar to Apache are Tohono O'odham (21.6%, a difference of 0.10%), Pueblo (21.6%, a difference of 0.18%), Yuman (21.3%, a difference of 1.3%), Arapaho (21.9%, a difference of 1.7%), and Sioux (22.2%, a difference of 2.9%).
| Demographics | Rating | Rank | Single Male Poverty |
| Cajuns | 0.0 /100 | #330 | Tragic 19.1% |
| Paiute | 0.0 /100 | #331 | Tragic 19.3% |
| Natives/Alaskans | 0.0 /100 | #332 | Tragic 19.6% |
| Inupiat | 0.0 /100 | #333 | Tragic 20.0% |
| Pima | 0.0 /100 | #334 | Tragic 20.2% |
| Yuman | 0.0 /100 | #335 | Tragic 21.3% |
| Tohono O'odham | 0.0 /100 | #336 | Tragic 21.6% |
| Apache | 0.0 /100 | #337 | Tragic 21.6% |
| Pueblo | 0.0 /100 | #338 | Tragic 21.6% |
| Arapaho | 0.0 /100 | #339 | Tragic 21.9% |
| Sioux | 0.0 /100 | #340 | Tragic 22.2% |
| Crow | 0.0 /100 | #341 | Tragic 23.3% |
| Houma | 0.0 /100 | #342 | Tragic 23.5% |
| Puerto Ricans | 0.0 /100 | #343 | Tragic 25.1% |
| Lumbee | 0.0 /100 | #344 | Tragic 25.2% |