Honduran vs Basque Single Male Poverty
COMPARE
Honduran
Basque
Single Male Poverty
Single Male Poverty Comparison
Hondurans
Basques
14.0%
SINGLE MALE POVERTY
0.1/ 100
METRIC RATING
274th/ 347
METRIC RANK
13.0%
SINGLE MALE POVERTY
20.7/ 100
METRIC RATING
202nd/ 347
METRIC RANK
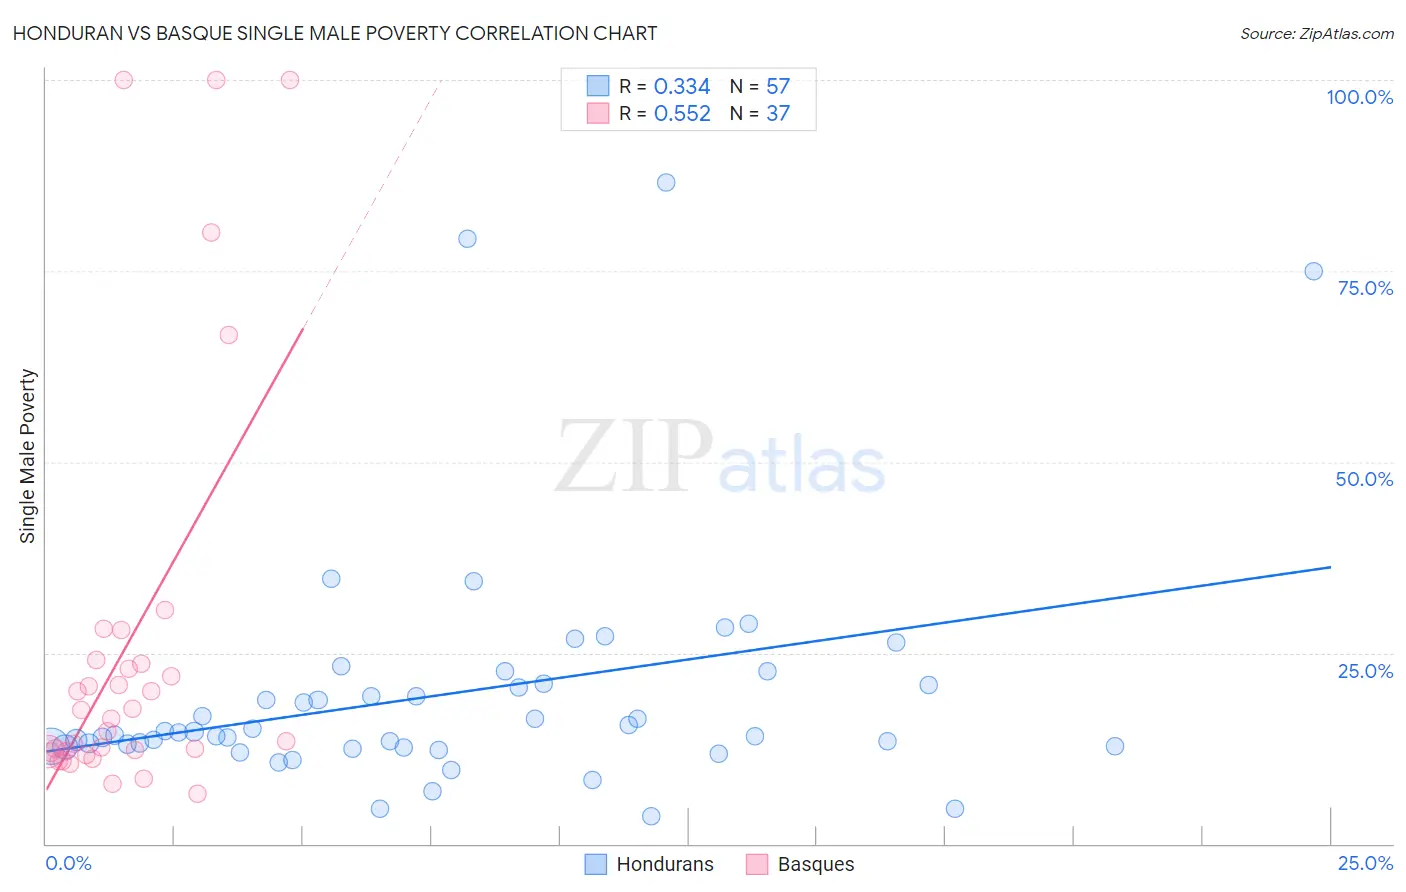
Honduran vs Basque Single Male Poverty Correlation Chart
The statistical analysis conducted on geographies consisting of 327,718,119 people shows a mild positive correlation between the proportion of Hondurans and poverty level among single males in the United States with a correlation coefficient (R) of 0.334 and weighted average of 14.0%. Similarly, the statistical analysis conducted on geographies consisting of 155,521,610 people shows a substantial positive correlation between the proportion of Basques and poverty level among single males in the United States with a correlation coefficient (R) of 0.552 and weighted average of 13.0%, a difference of 7.9%.
Single Male Poverty Correlation Summary
| Measurement | Honduran | Basque |
| Minimum | 3.6% | 6.6% |
| Maximum | 86.6% | 100.0% |
| Range | 83.0% | 93.4% |
| Mean | 19.6% | 26.0% |
| Median | 14.6% | 16.3% |
| Interquartile 25% (IQ1) | 12.7% | 12.0% |
| Interquartile 75% (IQ3) | 20.9% | 23.8% |
| Interquartile Range (IQR) | 8.2% | 11.8% |
| Standard Deviation (Sample) | 15.9% | 26.5% |
| Standard Deviation (Population) | 15.8% | 26.2% |
Similar Demographics by Single Male Poverty
Demographics Similar to Hondurans by Single Male Poverty
In terms of single male poverty, the demographic groups most similar to Hondurans are English (14.1%, a difference of 0.080%), Welsh (14.0%, a difference of 0.13%), Dutch (14.1%, a difference of 0.19%), Immigrants from Honduras (14.1%, a difference of 0.23%), and Slovak (14.1%, a difference of 0.30%).
| Demographics | Rating | Rank | Single Male Poverty |
| Germans | 0.1 /100 | #267 | Tragic 13.9% |
| Immigrants | Mexico | 0.1 /100 | #268 | Tragic 13.9% |
| Scottish | 0.1 /100 | #269 | Tragic 14.0% |
| Immigrants | Saudi Arabia | 0.1 /100 | #270 | Tragic 14.0% |
| Irish | 0.1 /100 | #271 | Tragic 14.0% |
| Mexicans | 0.1 /100 | #272 | Tragic 14.0% |
| Welsh | 0.1 /100 | #273 | Tragic 14.0% |
| Hondurans | 0.1 /100 | #274 | Tragic 14.0% |
| English | 0.1 /100 | #275 | Tragic 14.1% |
| Dutch | 0.1 /100 | #276 | Tragic 14.1% |
| Immigrants | Honduras | 0.0 /100 | #277 | Tragic 14.1% |
| Slovaks | 0.0 /100 | #278 | Tragic 14.1% |
| Indonesians | 0.0 /100 | #279 | Tragic 14.1% |
| Hmong | 0.0 /100 | #280 | Tragic 14.2% |
| Hispanics or Latinos | 0.0 /100 | #281 | Tragic 14.2% |
Demographics Similar to Basques by Single Male Poverty
In terms of single male poverty, the demographic groups most similar to Basques are Immigrants from Bangladesh (13.0%, a difference of 0.030%), Estonian (13.0%, a difference of 0.030%), Trinidadian and Tobagonian (13.0%, a difference of 0.060%), Slovene (13.0%, a difference of 0.070%), and Immigrants from Norway (13.0%, a difference of 0.090%).
| Demographics | Rating | Rank | Single Male Poverty |
| Immigrants | England | 23.4 /100 | #195 | Fair 13.0% |
| Immigrants | Grenada | 23.1 /100 | #196 | Fair 13.0% |
| Immigrants | Laos | 23.1 /100 | #197 | Fair 13.0% |
| Lithuanians | 22.1 /100 | #198 | Fair 13.0% |
| Immigrants | Norway | 21.8 /100 | #199 | Fair 13.0% |
| Slovenes | 21.6 /100 | #200 | Fair 13.0% |
| Trinidadians and Tobagonians | 21.4 /100 | #201 | Fair 13.0% |
| Basques | 20.7 /100 | #202 | Fair 13.0% |
| Immigrants | Bangladesh | 20.4 /100 | #203 | Fair 13.0% |
| Estonians | 20.3 /100 | #204 | Fair 13.0% |
| Poles | 19.3 /100 | #205 | Poor 13.0% |
| Northern Europeans | 18.9 /100 | #206 | Poor 13.0% |
| Sudanese | 17.7 /100 | #207 | Poor 13.1% |
| Immigrants | Western Africa | 17.6 /100 | #208 | Poor 13.1% |
| Mexican American Indians | 17.5 /100 | #209 | Poor 13.1% |