Hispanic or Latino vs Apache Single Male Poverty
COMPARE
Hispanic or Latino
Apache
Single Male Poverty
Single Male Poverty Comparison
Hispanics or Latinos
Apache
14.2%
SINGLE MALE POVERTY
0.0/ 100
METRIC RATING
281st/ 347
METRIC RANK
21.6%
SINGLE MALE POVERTY
0.0/ 100
METRIC RATING
337th/ 347
METRIC RANK
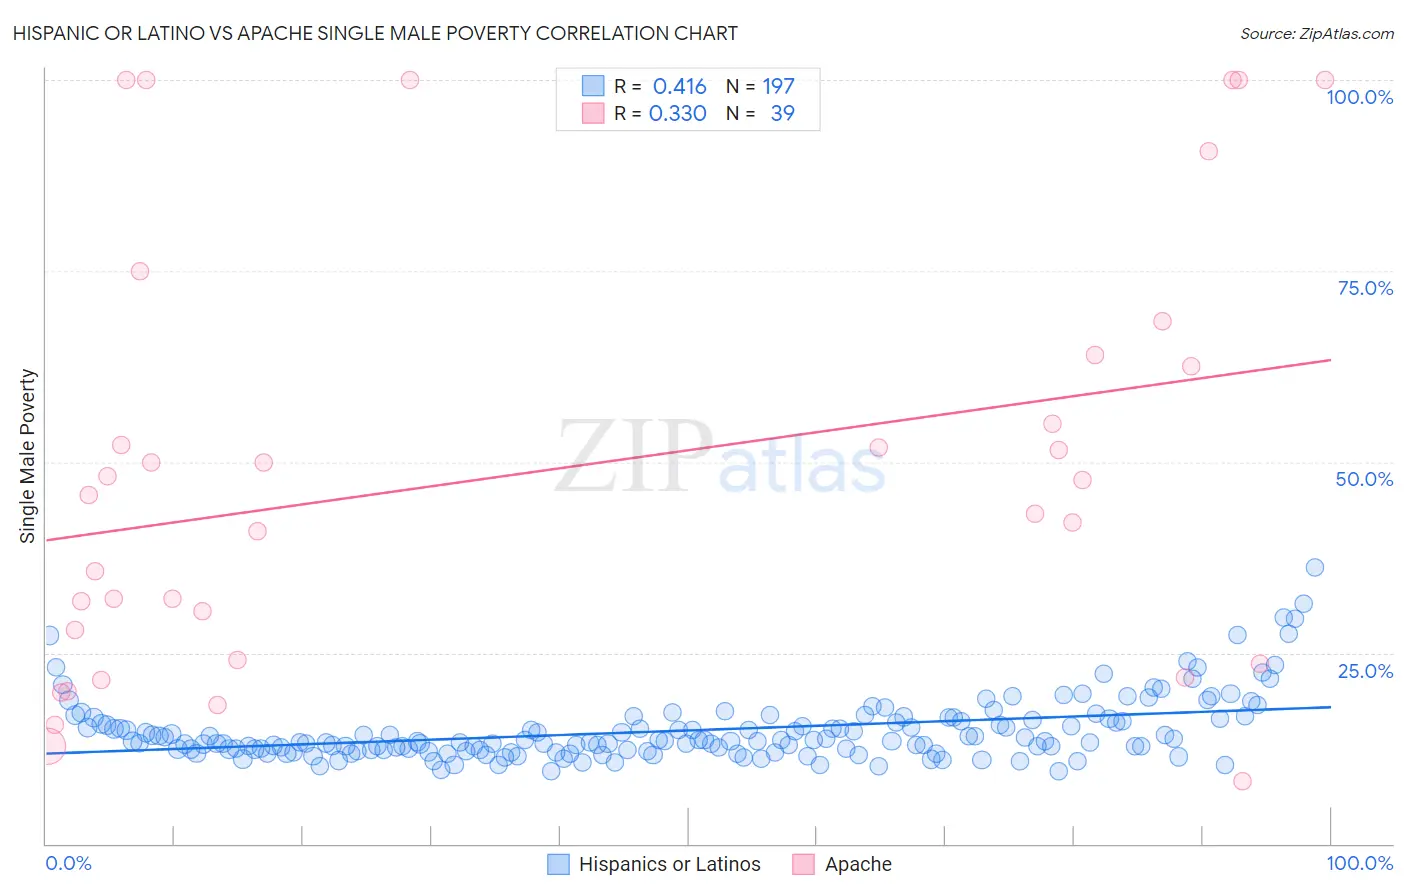
Hispanic or Latino vs Apache Single Male Poverty Correlation Chart
The statistical analysis conducted on geographies consisting of 473,841,382 people shows a moderate positive correlation between the proportion of Hispanics or Latinos and poverty level among single males in the United States with a correlation coefficient (R) of 0.416 and weighted average of 14.2%. Similarly, the statistical analysis conducted on geographies consisting of 216,687,885 people shows a mild positive correlation between the proportion of Apache and poverty level among single males in the United States with a correlation coefficient (R) of 0.330 and weighted average of 21.6%, a difference of 51.9%.
Single Male Poverty Correlation Summary
| Measurement | Hispanic or Latino | Apache |
| Minimum | 9.5% | 8.2% |
| Maximum | 36.1% | 100.0% |
| Range | 26.6% | 91.8% |
| Mean | 14.8% | 49.1% |
| Median | 13.5% | 45.6% |
| Interquartile 25% (IQ1) | 12.3% | 24.1% |
| Interquartile 75% (IQ3) | 16.2% | 64.0% |
| Interquartile Range (IQR) | 3.8% | 39.9% |
| Standard Deviation (Sample) | 4.2% | 28.3% |
| Standard Deviation (Population) | 4.2% | 27.9% |
Similar Demographics by Single Male Poverty
Demographics Similar to Hispanics or Latinos by Single Male Poverty
In terms of single male poverty, the demographic groups most similar to Hispanics or Latinos are Hmong (14.2%, a difference of 0.030%), Spanish American (14.2%, a difference of 0.16%), Yaqui (14.2%, a difference of 0.32%), Indonesian (14.1%, a difference of 0.73%), and Slovak (14.1%, a difference of 0.77%).
| Demographics | Rating | Rank | Single Male Poverty |
| Hondurans | 0.1 /100 | #274 | Tragic 14.0% |
| English | 0.1 /100 | #275 | Tragic 14.1% |
| Dutch | 0.1 /100 | #276 | Tragic 14.1% |
| Immigrants | Honduras | 0.0 /100 | #277 | Tragic 14.1% |
| Slovaks | 0.0 /100 | #278 | Tragic 14.1% |
| Indonesians | 0.0 /100 | #279 | Tragic 14.1% |
| Hmong | 0.0 /100 | #280 | Tragic 14.2% |
| Hispanics or Latinos | 0.0 /100 | #281 | Tragic 14.2% |
| Spanish Americans | 0.0 /100 | #282 | Tragic 14.2% |
| Yaqui | 0.0 /100 | #283 | Tragic 14.2% |
| Immigrants | Bahamas | 0.0 /100 | #284 | Tragic 14.4% |
| French | 0.0 /100 | #285 | Tragic 14.4% |
| Celtics | 0.0 /100 | #286 | Tragic 14.5% |
| Iroquois | 0.0 /100 | #287 | Tragic 14.5% |
| Whites/Caucasians | 0.0 /100 | #288 | Tragic 14.5% |
Demographics Similar to Apache by Single Male Poverty
In terms of single male poverty, the demographic groups most similar to Apache are Tohono O'odham (21.6%, a difference of 0.10%), Pueblo (21.6%, a difference of 0.18%), Yuman (21.3%, a difference of 1.3%), Arapaho (21.9%, a difference of 1.7%), and Sioux (22.2%, a difference of 2.9%).
| Demographics | Rating | Rank | Single Male Poverty |
| Cajuns | 0.0 /100 | #330 | Tragic 19.1% |
| Paiute | 0.0 /100 | #331 | Tragic 19.3% |
| Natives/Alaskans | 0.0 /100 | #332 | Tragic 19.6% |
| Inupiat | 0.0 /100 | #333 | Tragic 20.0% |
| Pima | 0.0 /100 | #334 | Tragic 20.2% |
| Yuman | 0.0 /100 | #335 | Tragic 21.3% |
| Tohono O'odham | 0.0 /100 | #336 | Tragic 21.6% |
| Apache | 0.0 /100 | #337 | Tragic 21.6% |
| Pueblo | 0.0 /100 | #338 | Tragic 21.6% |
| Arapaho | 0.0 /100 | #339 | Tragic 21.9% |
| Sioux | 0.0 /100 | #340 | Tragic 22.2% |
| Crow | 0.0 /100 | #341 | Tragic 23.3% |
| Houma | 0.0 /100 | #342 | Tragic 23.5% |
| Puerto Ricans | 0.0 /100 | #343 | Tragic 25.1% |
| Lumbee | 0.0 /100 | #344 | Tragic 25.2% |