Honduran vs Thai Single Male Poverty
COMPARE
Honduran
Thai
Single Male Poverty
Single Male Poverty Comparison
Hondurans
Thais
14.0%
SINGLE MALE POVERTY
0.1/ 100
METRIC RATING
274th/ 347
METRIC RANK
10.8%
SINGLE MALE POVERTY
100.0/ 100
METRIC RATING
8th/ 347
METRIC RANK
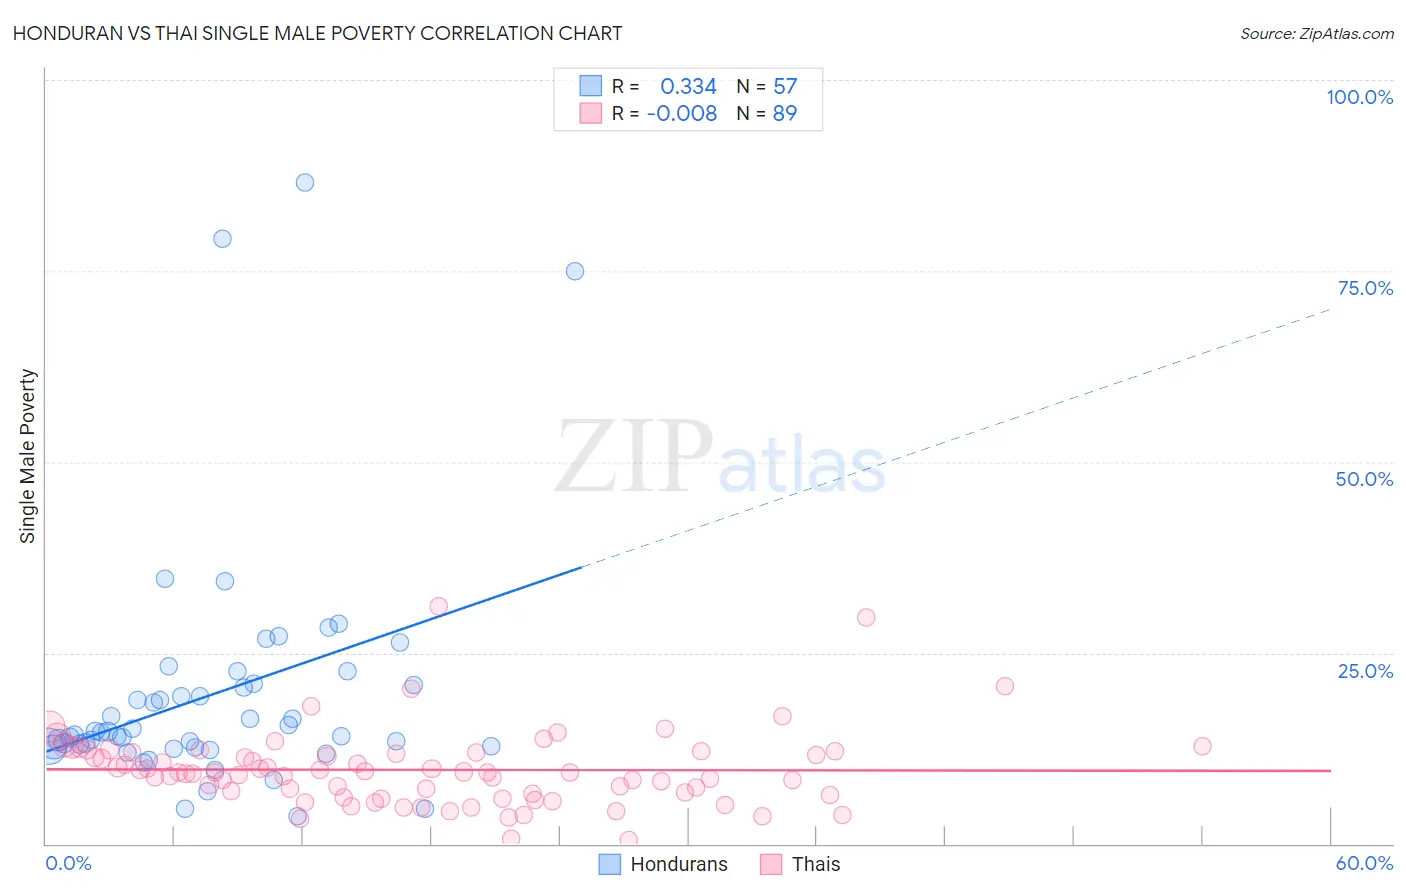
Honduran vs Thai Single Male Poverty Correlation Chart
The statistical analysis conducted on geographies consisting of 327,718,119 people shows a mild positive correlation between the proportion of Hondurans and poverty level among single males in the United States with a correlation coefficient (R) of 0.334 and weighted average of 14.0%. Similarly, the statistical analysis conducted on geographies consisting of 412,300,186 people shows no correlation between the proportion of Thais and poverty level among single males in the United States with a correlation coefficient (R) of -0.008 and weighted average of 10.8%, a difference of 30.6%.
Single Male Poverty Correlation Summary
| Measurement | Honduran | Thai |
| Minimum | 3.6% | 0.44% |
| Maximum | 86.6% | 31.0% |
| Range | 83.0% | 30.6% |
| Mean | 19.6% | 9.7% |
| Median | 14.6% | 9.3% |
| Interquartile 25% (IQ1) | 12.7% | 6.4% |
| Interquartile 75% (IQ3) | 20.9% | 12.0% |
| Interquartile Range (IQR) | 8.2% | 5.6% |
| Standard Deviation (Sample) | 15.9% | 5.0% |
| Standard Deviation (Population) | 15.8% | 4.9% |
Similar Demographics by Single Male Poverty
Demographics Similar to Hondurans by Single Male Poverty
In terms of single male poverty, the demographic groups most similar to Hondurans are English (14.1%, a difference of 0.080%), Welsh (14.0%, a difference of 0.13%), Dutch (14.1%, a difference of 0.19%), Immigrants from Honduras (14.1%, a difference of 0.23%), and Slovak (14.1%, a difference of 0.30%).
| Demographics | Rating | Rank | Single Male Poverty |
| Germans | 0.1 /100 | #267 | Tragic 13.9% |
| Immigrants | Mexico | 0.1 /100 | #268 | Tragic 13.9% |
| Scottish | 0.1 /100 | #269 | Tragic 14.0% |
| Immigrants | Saudi Arabia | 0.1 /100 | #270 | Tragic 14.0% |
| Irish | 0.1 /100 | #271 | Tragic 14.0% |
| Mexicans | 0.1 /100 | #272 | Tragic 14.0% |
| Welsh | 0.1 /100 | #273 | Tragic 14.0% |
| Hondurans | 0.1 /100 | #274 | Tragic 14.0% |
| English | 0.1 /100 | #275 | Tragic 14.1% |
| Dutch | 0.1 /100 | #276 | Tragic 14.1% |
| Immigrants | Honduras | 0.0 /100 | #277 | Tragic 14.1% |
| Slovaks | 0.0 /100 | #278 | Tragic 14.1% |
| Indonesians | 0.0 /100 | #279 | Tragic 14.1% |
| Hmong | 0.0 /100 | #280 | Tragic 14.2% |
| Hispanics or Latinos | 0.0 /100 | #281 | Tragic 14.2% |
Demographics Similar to Thais by Single Male Poverty
In terms of single male poverty, the demographic groups most similar to Thais are Afghan (10.7%, a difference of 0.47%), Filipino (10.6%, a difference of 1.2%), Taiwanese (10.9%, a difference of 1.3%), Immigrants from Fiji (10.9%, a difference of 1.3%), and Immigrants from Philippines (10.9%, a difference of 1.3%).
| Demographics | Rating | Rank | Single Male Poverty |
| Assyrians/Chaldeans/Syriacs | 100.0 /100 | #1 | Exceptional 9.8% |
| Immigrants | Taiwan | 100.0 /100 | #2 | Exceptional 10.3% |
| Immigrants | India | 100.0 /100 | #3 | Exceptional 10.3% |
| Immigrants | Hong Kong | 100.0 /100 | #4 | Exceptional 10.4% |
| Tongans | 100.0 /100 | #5 | Exceptional 10.5% |
| Filipinos | 100.0 /100 | #6 | Exceptional 10.6% |
| Afghans | 100.0 /100 | #7 | Exceptional 10.7% |
| Thais | 100.0 /100 | #8 | Exceptional 10.8% |
| Taiwanese | 100.0 /100 | #9 | Exceptional 10.9% |
| Immigrants | Fiji | 100.0 /100 | #10 | Exceptional 10.9% |
| Immigrants | Philippines | 100.0 /100 | #11 | Exceptional 10.9% |
| Immigrants | Afghanistan | 100.0 /100 | #12 | Exceptional 10.9% |
| Immigrants | South Central Asia | 100.0 /100 | #13 | Exceptional 10.9% |
| Chinese | 100.0 /100 | #14 | Exceptional 11.0% |
| Koreans | 100.0 /100 | #15 | Exceptional 11.0% |