Honduran vs Immigrants from Lithuania Single Male Poverty
COMPARE
Honduran
Immigrants from Lithuania
Single Male Poverty
Single Male Poverty Comparison
Hondurans
Immigrants from Lithuania
14.0%
SINGLE MALE POVERTY
0.1/ 100
METRIC RATING
274th/ 347
METRIC RANK
11.6%
SINGLE MALE POVERTY
99.9/ 100
METRIC RATING
50th/ 347
METRIC RANK
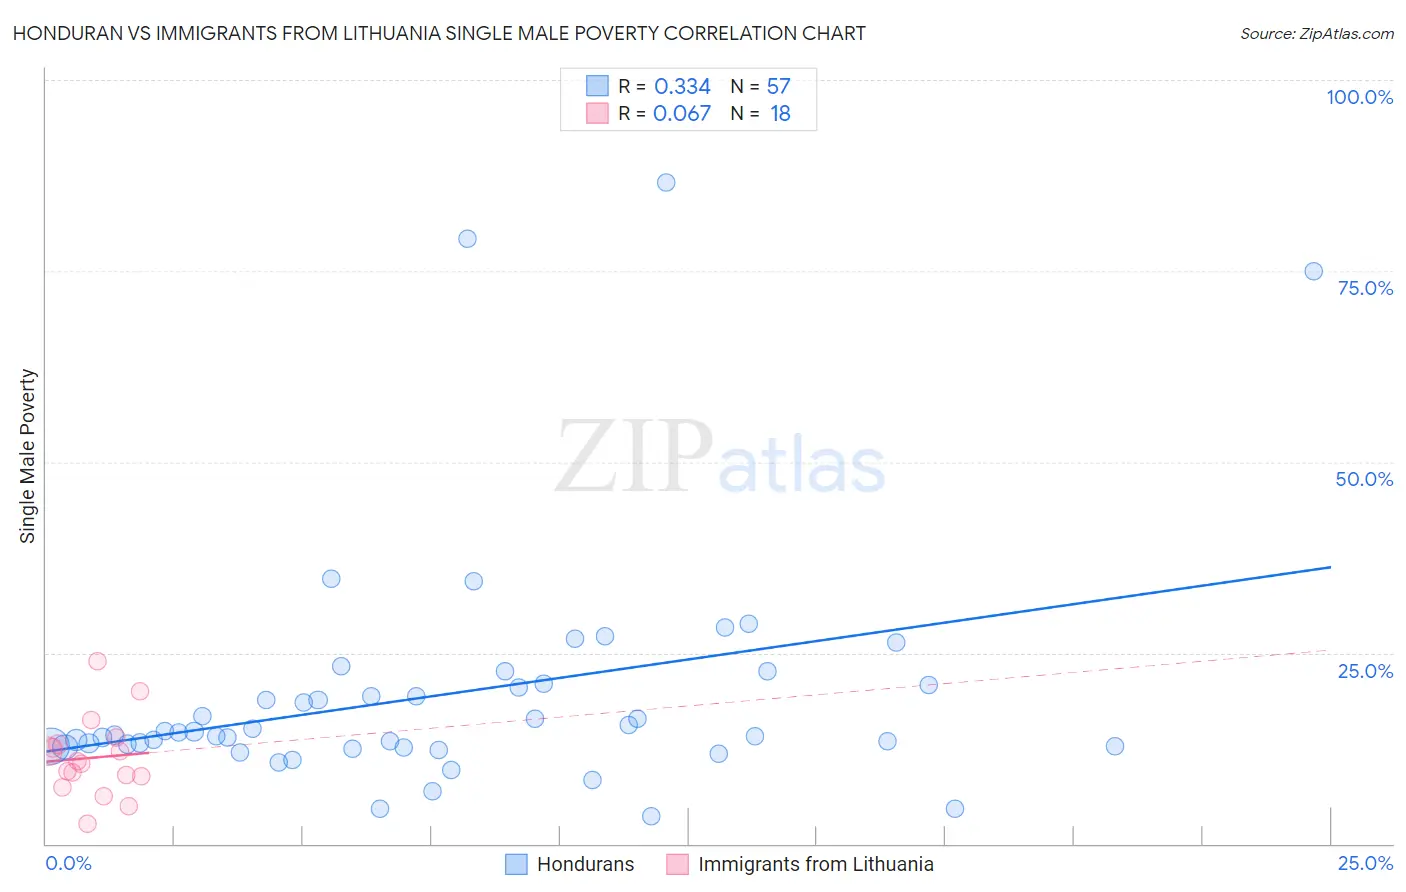
Honduran vs Immigrants from Lithuania Single Male Poverty Correlation Chart
The statistical analysis conducted on geographies consisting of 327,718,119 people shows a mild positive correlation between the proportion of Hondurans and poverty level among single males in the United States with a correlation coefficient (R) of 0.334 and weighted average of 14.0%. Similarly, the statistical analysis conducted on geographies consisting of 108,687,768 people shows a slight positive correlation between the proportion of Immigrants from Lithuania and poverty level among single males in the United States with a correlation coefficient (R) of 0.067 and weighted average of 11.6%, a difference of 21.1%.
Single Male Poverty Correlation Summary
| Measurement | Honduran | Immigrants from Lithuania |
| Minimum | 3.6% | 2.6% |
| Maximum | 86.6% | 23.9% |
| Range | 83.0% | 21.3% |
| Mean | 19.6% | 11.3% |
| Median | 14.6% | 10.7% |
| Interquartile 25% (IQ1) | 12.7% | 8.9% |
| Interquartile 75% (IQ3) | 20.9% | 13.0% |
| Interquartile Range (IQR) | 8.2% | 4.2% |
| Standard Deviation (Sample) | 15.9% | 5.1% |
| Standard Deviation (Population) | 15.8% | 5.0% |
Similar Demographics by Single Male Poverty
Demographics Similar to Hondurans by Single Male Poverty
In terms of single male poverty, the demographic groups most similar to Hondurans are English (14.1%, a difference of 0.080%), Welsh (14.0%, a difference of 0.13%), Dutch (14.1%, a difference of 0.19%), Immigrants from Honduras (14.1%, a difference of 0.23%), and Slovak (14.1%, a difference of 0.30%).
| Demographics | Rating | Rank | Single Male Poverty |
| Germans | 0.1 /100 | #267 | Tragic 13.9% |
| Immigrants | Mexico | 0.1 /100 | #268 | Tragic 13.9% |
| Scottish | 0.1 /100 | #269 | Tragic 14.0% |
| Immigrants | Saudi Arabia | 0.1 /100 | #270 | Tragic 14.0% |
| Irish | 0.1 /100 | #271 | Tragic 14.0% |
| Mexicans | 0.1 /100 | #272 | Tragic 14.0% |
| Welsh | 0.1 /100 | #273 | Tragic 14.0% |
| Hondurans | 0.1 /100 | #274 | Tragic 14.0% |
| English | 0.1 /100 | #275 | Tragic 14.1% |
| Dutch | 0.1 /100 | #276 | Tragic 14.1% |
| Immigrants | Honduras | 0.0 /100 | #277 | Tragic 14.1% |
| Slovaks | 0.0 /100 | #278 | Tragic 14.1% |
| Indonesians | 0.0 /100 | #279 | Tragic 14.1% |
| Hmong | 0.0 /100 | #280 | Tragic 14.2% |
| Hispanics or Latinos | 0.0 /100 | #281 | Tragic 14.2% |
Demographics Similar to Immigrants from Lithuania by Single Male Poverty
In terms of single male poverty, the demographic groups most similar to Immigrants from Lithuania are Tlingit-Haida (11.6%, a difference of 0.060%), Immigrants from Indonesia (11.6%, a difference of 0.080%), Paraguayan (11.6%, a difference of 0.11%), Nepalese (11.6%, a difference of 0.15%), and Immigrants from Bulgaria (11.6%, a difference of 0.35%).
| Demographics | Rating | Rank | Single Male Poverty |
| Immigrants | Peru | 99.9 /100 | #43 | Exceptional 11.5% |
| Immigrants | Cameroon | 99.9 /100 | #44 | Exceptional 11.5% |
| Immigrants | Poland | 99.9 /100 | #45 | Exceptional 11.5% |
| Immigrants | Bulgaria | 99.9 /100 | #46 | Exceptional 11.6% |
| Nepalese | 99.9 /100 | #47 | Exceptional 11.6% |
| Immigrants | Indonesia | 99.9 /100 | #48 | Exceptional 11.6% |
| Tlingit-Haida | 99.9 /100 | #49 | Exceptional 11.6% |
| Immigrants | Lithuania | 99.9 /100 | #50 | Exceptional 11.6% |
| Paraguayans | 99.9 /100 | #51 | Exceptional 11.6% |
| Samoans | 99.9 /100 | #52 | Exceptional 11.7% |
| Bulgarians | 99.9 /100 | #53 | Exceptional 11.7% |
| Immigrants | Uzbekistan | 99.9 /100 | #54 | Exceptional 11.7% |
| Cypriots | 99.9 /100 | #55 | Exceptional 11.7% |
| Burmese | 99.8 /100 | #56 | Exceptional 11.7% |
| Immigrants | Romania | 99.8 /100 | #57 | Exceptional 11.7% |