Chilean vs Apache Single Male Poverty
COMPARE
Chilean
Apache
Single Male Poverty
Single Male Poverty Comparison
Chileans
Apache
11.9%
SINGLE MALE POVERTY
99.5/ 100
METRIC RATING
74th/ 347
METRIC RANK
21.6%
SINGLE MALE POVERTY
0.0/ 100
METRIC RATING
337th/ 347
METRIC RANK
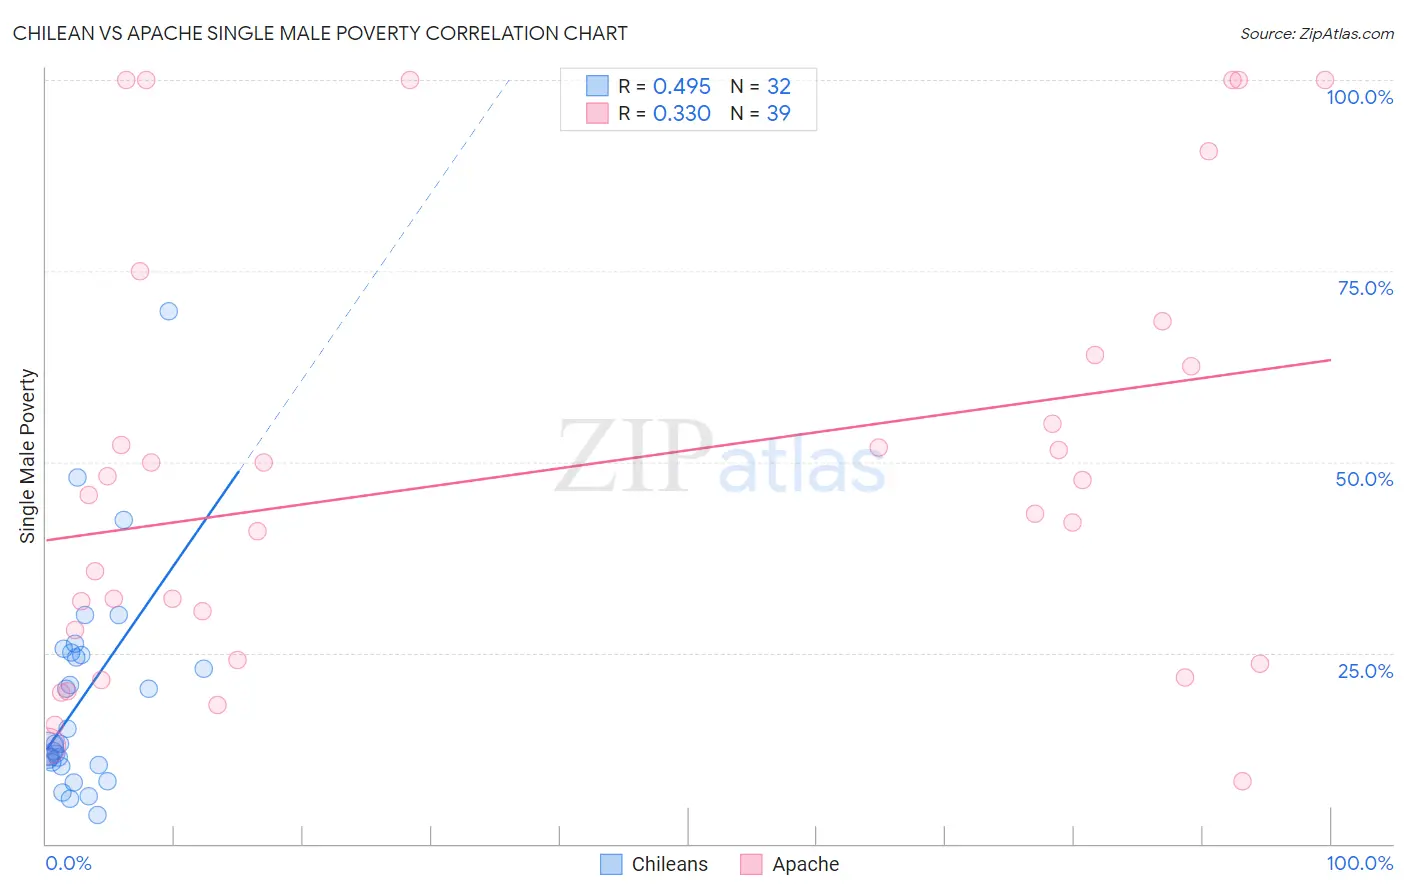
Chilean vs Apache Single Male Poverty Correlation Chart
The statistical analysis conducted on geographies consisting of 235,919,497 people shows a moderate positive correlation between the proportion of Chileans and poverty level among single males in the United States with a correlation coefficient (R) of 0.495 and weighted average of 11.9%. Similarly, the statistical analysis conducted on geographies consisting of 216,687,885 people shows a mild positive correlation between the proportion of Apache and poverty level among single males in the United States with a correlation coefficient (R) of 0.330 and weighted average of 21.6%, a difference of 81.0%.
Single Male Poverty Correlation Summary
| Measurement | Chilean | Apache |
| Minimum | 3.8% | 8.2% |
| Maximum | 69.8% | 100.0% |
| Range | 66.0% | 91.8% |
| Mean | 19.1% | 49.1% |
| Median | 13.1% | 45.6% |
| Interquartile 25% (IQ1) | 10.5% | 24.1% |
| Interquartile 75% (IQ3) | 24.9% | 64.0% |
| Interquartile Range (IQR) | 14.3% | 39.9% |
| Standard Deviation (Sample) | 13.9% | 28.3% |
| Standard Deviation (Population) | 13.7% | 27.9% |
Similar Demographics by Single Male Poverty
Demographics Similar to Chileans by Single Male Poverty
In terms of single male poverty, the demographic groups most similar to Chileans are Argentinean (11.9%, a difference of 0.060%), Immigrants from Argentina (11.9%, a difference of 0.18%), Uruguayan (11.9%, a difference of 0.19%), Immigrants from Northern Africa (11.9%, a difference of 0.22%), and Immigrants from Greece (11.9%, a difference of 0.36%).
| Demographics | Rating | Rank | Single Male Poverty |
| Immigrants | Ukraine | 99.6 /100 | #67 | Exceptional 11.9% |
| Immigrants | Croatia | 99.6 /100 | #68 | Exceptional 11.9% |
| Immigrants | Russia | 99.6 /100 | #69 | Exceptional 11.9% |
| Immigrants | Nepal | 99.6 /100 | #70 | Exceptional 11.9% |
| Immigrants | Greece | 99.6 /100 | #71 | Exceptional 11.9% |
| Immigrants | Argentina | 99.5 /100 | #72 | Exceptional 11.9% |
| Argentineans | 99.5 /100 | #73 | Exceptional 11.9% |
| Chileans | 99.5 /100 | #74 | Exceptional 11.9% |
| Uruguayans | 99.4 /100 | #75 | Exceptional 11.9% |
| Immigrants | Northern Africa | 99.4 /100 | #76 | Exceptional 11.9% |
| Immigrants | Malaysia | 99.2 /100 | #77 | Exceptional 12.0% |
| Immigrants | Venezuela | 99.1 /100 | #78 | Exceptional 12.0% |
| Immigrants | Belgium | 99.0 /100 | #79 | Exceptional 12.0% |
| Armenians | 98.7 /100 | #80 | Exceptional 12.1% |
| Immigrants | South America | 98.7 /100 | #81 | Exceptional 12.1% |
Demographics Similar to Apache by Single Male Poverty
In terms of single male poverty, the demographic groups most similar to Apache are Tohono O'odham (21.6%, a difference of 0.10%), Pueblo (21.6%, a difference of 0.18%), Yuman (21.3%, a difference of 1.3%), Arapaho (21.9%, a difference of 1.7%), and Sioux (22.2%, a difference of 2.9%).
| Demographics | Rating | Rank | Single Male Poverty |
| Cajuns | 0.0 /100 | #330 | Tragic 19.1% |
| Paiute | 0.0 /100 | #331 | Tragic 19.3% |
| Natives/Alaskans | 0.0 /100 | #332 | Tragic 19.6% |
| Inupiat | 0.0 /100 | #333 | Tragic 20.0% |
| Pima | 0.0 /100 | #334 | Tragic 20.2% |
| Yuman | 0.0 /100 | #335 | Tragic 21.3% |
| Tohono O'odham | 0.0 /100 | #336 | Tragic 21.6% |
| Apache | 0.0 /100 | #337 | Tragic 21.6% |
| Pueblo | 0.0 /100 | #338 | Tragic 21.6% |
| Arapaho | 0.0 /100 | #339 | Tragic 21.9% |
| Sioux | 0.0 /100 | #340 | Tragic 22.2% |
| Crow | 0.0 /100 | #341 | Tragic 23.3% |
| Houma | 0.0 /100 | #342 | Tragic 23.5% |
| Puerto Ricans | 0.0 /100 | #343 | Tragic 25.1% |
| Lumbee | 0.0 /100 | #344 | Tragic 25.2% |