Honduran vs Hawaiian Single Male Poverty
COMPARE
Honduran
Hawaiian
Single Male Poverty
Single Male Poverty Comparison
Hondurans
Hawaiians
14.0%
SINGLE MALE POVERTY
0.1/ 100
METRIC RATING
274th/ 347
METRIC RANK
12.6%
SINGLE MALE POVERTY
75.1/ 100
METRIC RATING
144th/ 347
METRIC RANK
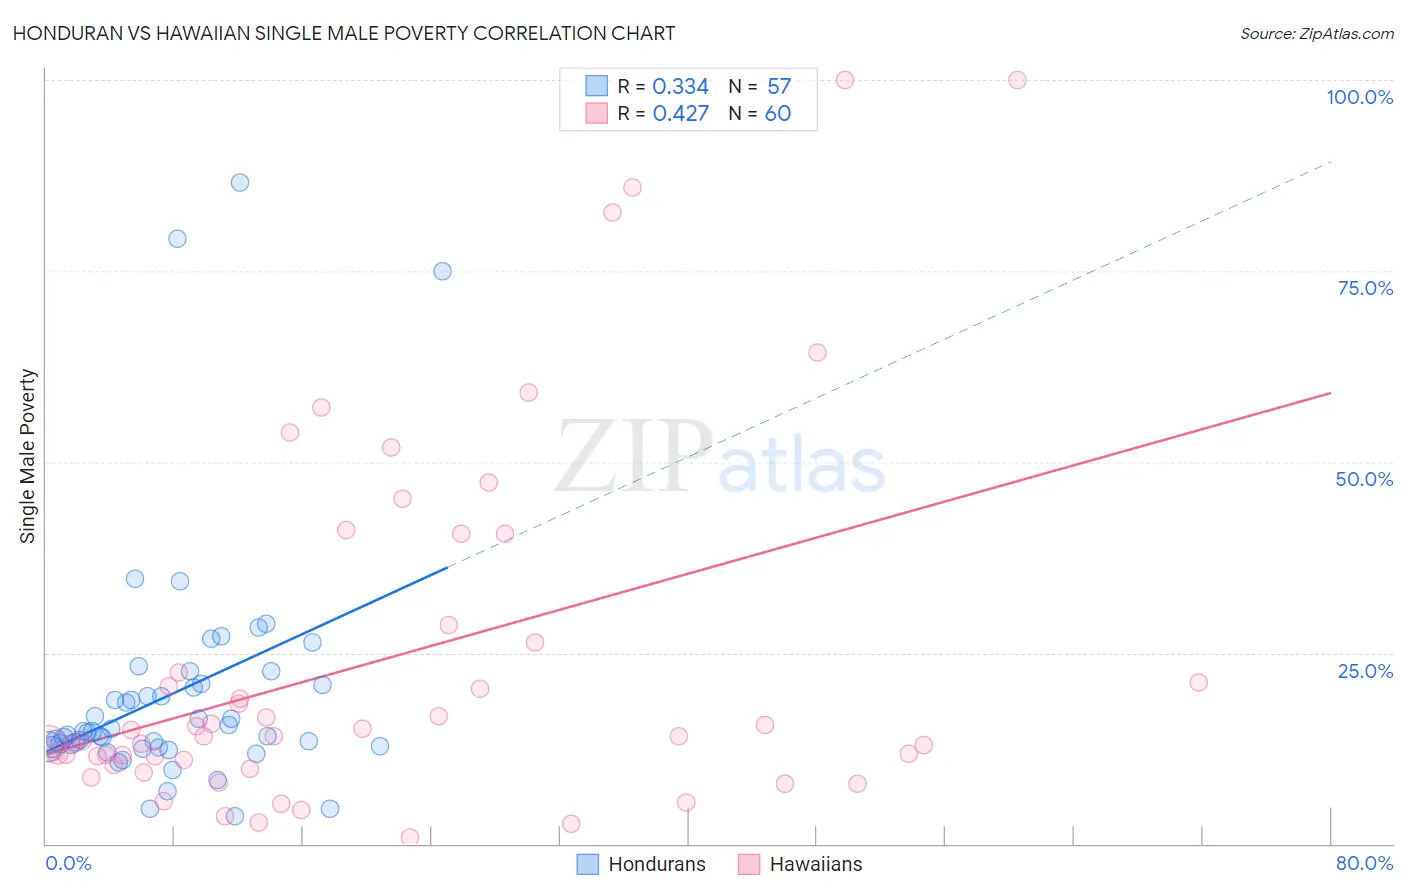
Honduran vs Hawaiian Single Male Poverty Correlation Chart
The statistical analysis conducted on geographies consisting of 327,718,119 people shows a mild positive correlation between the proportion of Hondurans and poverty level among single males in the United States with a correlation coefficient (R) of 0.334 and weighted average of 14.0%. Similarly, the statistical analysis conducted on geographies consisting of 300,272,441 people shows a moderate positive correlation between the proportion of Hawaiians and poverty level among single males in the United States with a correlation coefficient (R) of 0.427 and weighted average of 12.6%, a difference of 11.4%.
Single Male Poverty Correlation Summary
| Measurement | Honduran | Hawaiian |
| Minimum | 3.6% | 0.75% |
| Maximum | 86.6% | 100.0% |
| Range | 83.0% | 99.3% |
| Mean | 19.6% | 24.1% |
| Median | 14.6% | 14.1% |
| Interquartile 25% (IQ1) | 12.7% | 10.7% |
| Interquartile 75% (IQ3) | 20.9% | 27.4% |
| Interquartile Range (IQR) | 8.2% | 16.7% |
| Standard Deviation (Sample) | 15.9% | 24.0% |
| Standard Deviation (Population) | 15.8% | 23.8% |
Similar Demographics by Single Male Poverty
Demographics Similar to Hondurans by Single Male Poverty
In terms of single male poverty, the demographic groups most similar to Hondurans are English (14.1%, a difference of 0.080%), Welsh (14.0%, a difference of 0.13%), Dutch (14.1%, a difference of 0.19%), Immigrants from Honduras (14.1%, a difference of 0.23%), and Slovak (14.1%, a difference of 0.30%).
| Demographics | Rating | Rank | Single Male Poverty |
| Germans | 0.1 /100 | #267 | Tragic 13.9% |
| Immigrants | Mexico | 0.1 /100 | #268 | Tragic 13.9% |
| Scottish | 0.1 /100 | #269 | Tragic 14.0% |
| Immigrants | Saudi Arabia | 0.1 /100 | #270 | Tragic 14.0% |
| Irish | 0.1 /100 | #271 | Tragic 14.0% |
| Mexicans | 0.1 /100 | #272 | Tragic 14.0% |
| Welsh | 0.1 /100 | #273 | Tragic 14.0% |
| Hondurans | 0.1 /100 | #274 | Tragic 14.0% |
| English | 0.1 /100 | #275 | Tragic 14.1% |
| Dutch | 0.1 /100 | #276 | Tragic 14.1% |
| Immigrants | Honduras | 0.0 /100 | #277 | Tragic 14.1% |
| Slovaks | 0.0 /100 | #278 | Tragic 14.1% |
| Indonesians | 0.0 /100 | #279 | Tragic 14.1% |
| Hmong | 0.0 /100 | #280 | Tragic 14.2% |
| Hispanics or Latinos | 0.0 /100 | #281 | Tragic 14.2% |
Demographics Similar to Hawaiians by Single Male Poverty
In terms of single male poverty, the demographic groups most similar to Hawaiians are Immigrants from Lebanon (12.6%, a difference of 0.010%), Native Hawaiian (12.6%, a difference of 0.010%), Malaysian (12.6%, a difference of 0.020%), Immigrants from France (12.6%, a difference of 0.050%), and Okinawan (12.6%, a difference of 0.060%).
| Demographics | Rating | Rank | Single Male Poverty |
| Ukrainians | 80.7 /100 | #137 | Excellent 12.6% |
| Immigrants | El Salvador | 80.0 /100 | #138 | Excellent 12.6% |
| Cubans | 79.9 /100 | #139 | Good 12.6% |
| Immigrants | Zimbabwe | 78.0 /100 | #140 | Good 12.6% |
| Okinawans | 75.9 /100 | #141 | Good 12.6% |
| Immigrants | Uganda | 75.9 /100 | #142 | Good 12.6% |
| Immigrants | France | 75.8 /100 | #143 | Good 12.6% |
| Hawaiians | 75.1 /100 | #144 | Good 12.6% |
| Immigrants | Lebanon | 75.0 /100 | #145 | Good 12.6% |
| Native Hawaiians | 75.0 /100 | #146 | Good 12.6% |
| Malaysians | 74.8 /100 | #147 | Good 12.6% |
| Yugoslavians | 73.9 /100 | #148 | Good 12.6% |
| Sierra Leoneans | 73.0 /100 | #149 | Good 12.6% |
| Immigrants | Panama | 72.1 /100 | #150 | Good 12.6% |
| Immigrants | Hungary | 71.9 /100 | #151 | Good 12.6% |