Honduran vs Apache Unemployment Among Ages 55 to 59 years
COMPARE
Honduran
Apache
Unemployment Among Ages 55 to 59 years
Unemployment Among Ages 55 to 59 years Comparison
Hondurans
Apache
5.1%
UNEMPLOYMENT AMONG AGES 55 TO 59 YEARS
0.7/ 100
METRIC RATING
243rd/ 347
METRIC RANK
5.3%
UNEMPLOYMENT AMONG AGES 55 TO 59 YEARS
0.0/ 100
METRIC RATING
283rd/ 347
METRIC RANK
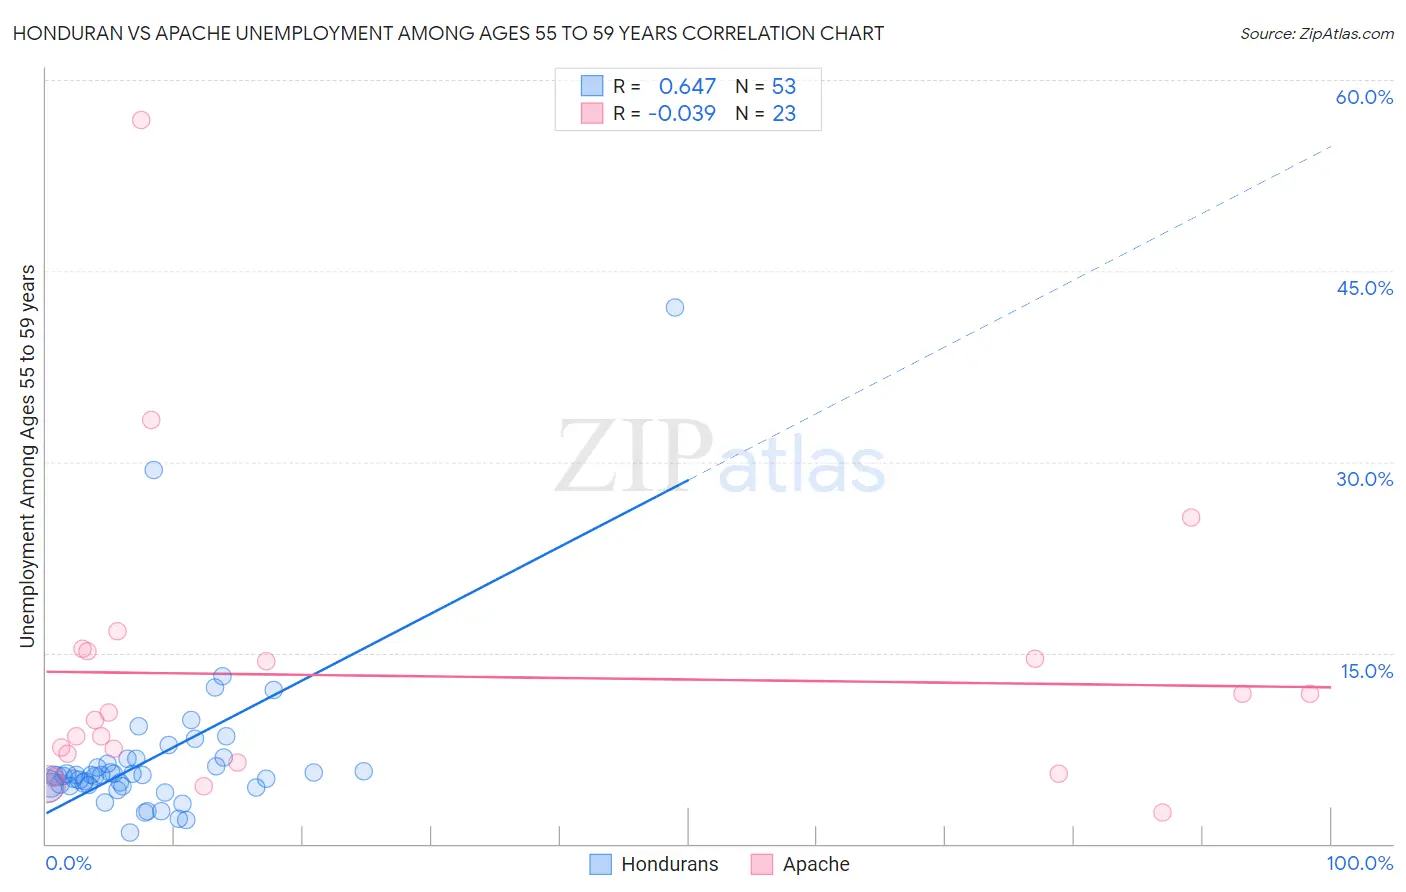
Honduran vs Apache Unemployment Among Ages 55 to 59 years Correlation Chart
The statistical analysis conducted on geographies consisting of 335,038,242 people shows a significant positive correlation between the proportion of Hondurans and unemployment rate among population between the ages 55 and 59 in the United States with a correlation coefficient (R) of 0.647 and weighted average of 5.1%. Similarly, the statistical analysis conducted on geographies consisting of 219,300,222 people shows no correlation between the proportion of Apache and unemployment rate among population between the ages 55 and 59 in the United States with a correlation coefficient (R) of -0.039 and weighted average of 5.3%, a difference of 4.3%.
Unemployment Among Ages 55 to 59 years Correlation Summary
| Measurement | Honduran | Apache |
| Minimum | 0.90% | 2.5% |
| Maximum | 42.1% | 56.8% |
| Range | 41.2% | 54.3% |
| Mean | 6.7% | 13.2% |
| Median | 5.3% | 9.7% |
| Interquartile 25% (IQ1) | 4.5% | 6.4% |
| Interquartile 75% (IQ3) | 6.4% | 15.2% |
| Interquartile Range (IQR) | 1.9% | 8.8% |
| Standard Deviation (Sample) | 6.4% | 11.8% |
| Standard Deviation (Population) | 6.3% | 11.6% |
Similar Demographics by Unemployment Among Ages 55 to 59 years
Demographics Similar to Hondurans by Unemployment Among Ages 55 to 59 years
In terms of unemployment among ages 55 to 59 years, the demographic groups most similar to Hondurans are Immigrants from Fiji (5.1%, a difference of 0.010%), Liberian (5.1%, a difference of 0.21%), Soviet Union (5.1%, a difference of 0.23%), Immigrants from Greece (5.1%, a difference of 0.24%), and Immigrants from Honduras (5.1%, a difference of 0.25%).
| Demographics | Rating | Rank | Unemployment Among Ages 55 to 59 years |
| Immigrants | Albania | 1.3 /100 | #236 | Tragic 5.0% |
| Choctaw | 1.3 /100 | #237 | Tragic 5.0% |
| Moroccans | 1.3 /100 | #238 | Tragic 5.0% |
| French American Indians | 1.2 /100 | #239 | Tragic 5.0% |
| Immigrants | Costa Rica | 1.1 /100 | #240 | Tragic 5.0% |
| Brazilians | 1.0 /100 | #241 | Tragic 5.0% |
| Liberians | 0.9 /100 | #242 | Tragic 5.1% |
| Hondurans | 0.7 /100 | #243 | Tragic 5.1% |
| Immigrants | Fiji | 0.7 /100 | #244 | Tragic 5.1% |
| Soviet Union | 0.6 /100 | #245 | Tragic 5.1% |
| Immigrants | Greece | 0.6 /100 | #246 | Tragic 5.1% |
| Immigrants | Honduras | 0.5 /100 | #247 | Tragic 5.1% |
| Native Hawaiians | 0.5 /100 | #248 | Tragic 5.1% |
| Comanche | 0.4 /100 | #249 | Tragic 5.1% |
| Cheyenne | 0.4 /100 | #250 | Tragic 5.1% |
Demographics Similar to Apache by Unemployment Among Ages 55 to 59 years
In terms of unemployment among ages 55 to 59 years, the demographic groups most similar to Apache are Immigrants from Trinidad and Tobago (5.3%, a difference of 0.030%), Ghanaian (5.3%, a difference of 0.040%), Armenian (5.3%, a difference of 0.14%), Immigrants from Ghana (5.3%, a difference of 0.26%), and Immigrants from Guatemala (5.3%, a difference of 0.28%).
| Demographics | Rating | Rank | Unemployment Among Ages 55 to 59 years |
| West Indians | 0.0 /100 | #276 | Tragic 5.2% |
| Immigrants | Latin America | 0.0 /100 | #277 | Tragic 5.2% |
| Immigrants | Barbados | 0.0 /100 | #278 | Tragic 5.2% |
| Alsatians | 0.0 /100 | #279 | Tragic 5.2% |
| Immigrants | Uzbekistan | 0.0 /100 | #280 | Tragic 5.3% |
| Guatemalans | 0.0 /100 | #281 | Tragic 5.3% |
| Immigrants | Trinidad and Tobago | 0.0 /100 | #282 | Tragic 5.3% |
| Apache | 0.0 /100 | #283 | Tragic 5.3% |
| Ghanaians | 0.0 /100 | #284 | Tragic 5.3% |
| Armenians | 0.0 /100 | #285 | Tragic 5.3% |
| Immigrants | Ghana | 0.0 /100 | #286 | Tragic 5.3% |
| Immigrants | Guatemala | 0.0 /100 | #287 | Tragic 5.3% |
| Immigrants | Israel | 0.0 /100 | #288 | Tragic 5.3% |
| Immigrants | Central America | 0.0 /100 | #289 | Tragic 5.3% |
| Sioux | 0.0 /100 | #290 | Tragic 5.3% |