Honduran vs Menominee Single Male Poverty
COMPARE
Honduran
Menominee
Single Male Poverty
Single Male Poverty Comparison
Hondurans
Menominee
14.0%
SINGLE MALE POVERTY
0.1/ 100
METRIC RATING
274th/ 347
METRIC RANK
17.7%
SINGLE MALE POVERTY
0.0/ 100
METRIC RATING
327th/ 347
METRIC RANK
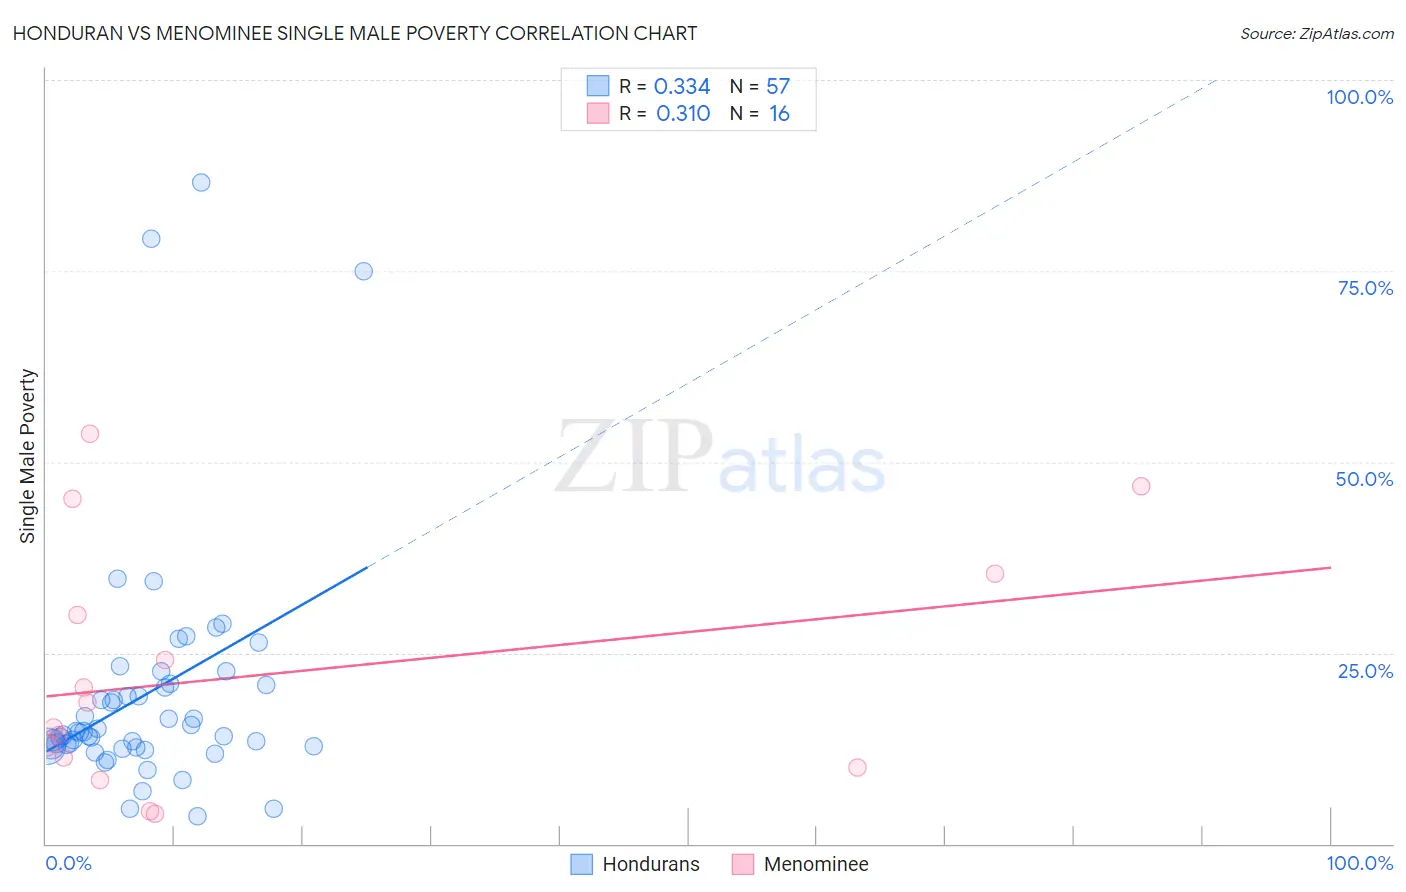
Honduran vs Menominee Single Male Poverty Correlation Chart
The statistical analysis conducted on geographies consisting of 327,718,119 people shows a mild positive correlation between the proportion of Hondurans and poverty level among single males in the United States with a correlation coefficient (R) of 0.334 and weighted average of 14.0%. Similarly, the statistical analysis conducted on geographies consisting of 44,140,338 people shows a mild positive correlation between the proportion of Menominee and poverty level among single males in the United States with a correlation coefficient (R) of 0.310 and weighted average of 17.7%, a difference of 26.1%.
Single Male Poverty Correlation Summary
| Measurement | Honduran | Menominee |
| Minimum | 3.6% | 3.9% |
| Maximum | 86.6% | 53.7% |
| Range | 83.0% | 49.8% |
| Mean | 19.6% | 22.1% |
| Median | 14.6% | 16.8% |
| Interquartile 25% (IQ1) | 12.7% | 10.7% |
| Interquartile 75% (IQ3) | 20.9% | 32.6% |
| Interquartile Range (IQR) | 8.2% | 22.0% |
| Standard Deviation (Sample) | 15.9% | 15.7% |
| Standard Deviation (Population) | 15.8% | 15.2% |
Similar Demographics by Single Male Poverty
Demographics Similar to Hondurans by Single Male Poverty
In terms of single male poverty, the demographic groups most similar to Hondurans are English (14.1%, a difference of 0.080%), Welsh (14.0%, a difference of 0.13%), Dutch (14.1%, a difference of 0.19%), Immigrants from Honduras (14.1%, a difference of 0.23%), and Slovak (14.1%, a difference of 0.30%).
| Demographics | Rating | Rank | Single Male Poverty |
| Germans | 0.1 /100 | #267 | Tragic 13.9% |
| Immigrants | Mexico | 0.1 /100 | #268 | Tragic 13.9% |
| Scottish | 0.1 /100 | #269 | Tragic 14.0% |
| Immigrants | Saudi Arabia | 0.1 /100 | #270 | Tragic 14.0% |
| Irish | 0.1 /100 | #271 | Tragic 14.0% |
| Mexicans | 0.1 /100 | #272 | Tragic 14.0% |
| Welsh | 0.1 /100 | #273 | Tragic 14.0% |
| Hondurans | 0.1 /100 | #274 | Tragic 14.0% |
| English | 0.1 /100 | #275 | Tragic 14.1% |
| Dutch | 0.1 /100 | #276 | Tragic 14.1% |
| Immigrants | Honduras | 0.0 /100 | #277 | Tragic 14.1% |
| Slovaks | 0.0 /100 | #278 | Tragic 14.1% |
| Indonesians | 0.0 /100 | #279 | Tragic 14.1% |
| Hmong | 0.0 /100 | #280 | Tragic 14.2% |
| Hispanics or Latinos | 0.0 /100 | #281 | Tragic 14.2% |
Demographics Similar to Menominee by Single Male Poverty
In terms of single male poverty, the demographic groups most similar to Menominee are Central American Indian (17.2%, a difference of 2.7%), Kiowa (18.3%, a difference of 3.3%), Colville (18.4%, a difference of 4.0%), Choctaw (17.0%, a difference of 4.3%), and Immigrants from Yemen (16.9%, a difference of 5.1%).
| Demographics | Rating | Rank | Single Male Poverty |
| Marshallese | 0.0 /100 | #320 | Tragic 16.4% |
| Osage | 0.0 /100 | #321 | Tragic 16.5% |
| Shoshone | 0.0 /100 | #322 | Tragic 16.7% |
| Creek | 0.0 /100 | #323 | Tragic 16.8% |
| Immigrants | Yemen | 0.0 /100 | #324 | Tragic 16.9% |
| Choctaw | 0.0 /100 | #325 | Tragic 17.0% |
| Central American Indians | 0.0 /100 | #326 | Tragic 17.2% |
| Menominee | 0.0 /100 | #327 | Tragic 17.7% |
| Kiowa | 0.0 /100 | #328 | Tragic 18.3% |
| Colville | 0.0 /100 | #329 | Tragic 18.4% |
| Cajuns | 0.0 /100 | #330 | Tragic 19.1% |
| Paiute | 0.0 /100 | #331 | Tragic 19.3% |
| Natives/Alaskans | 0.0 /100 | #332 | Tragic 19.6% |
| Inupiat | 0.0 /100 | #333 | Tragic 20.0% |
| Pima | 0.0 /100 | #334 | Tragic 20.2% |