Iroquois vs Apache Single Male Poverty
COMPARE
Iroquois
Apache
Single Male Poverty
Single Male Poverty Comparison
Iroquois
Apache
14.5%
SINGLE MALE POVERTY
0.0/ 100
METRIC RATING
287th/ 347
METRIC RANK
21.6%
SINGLE MALE POVERTY
0.0/ 100
METRIC RATING
337th/ 347
METRIC RANK
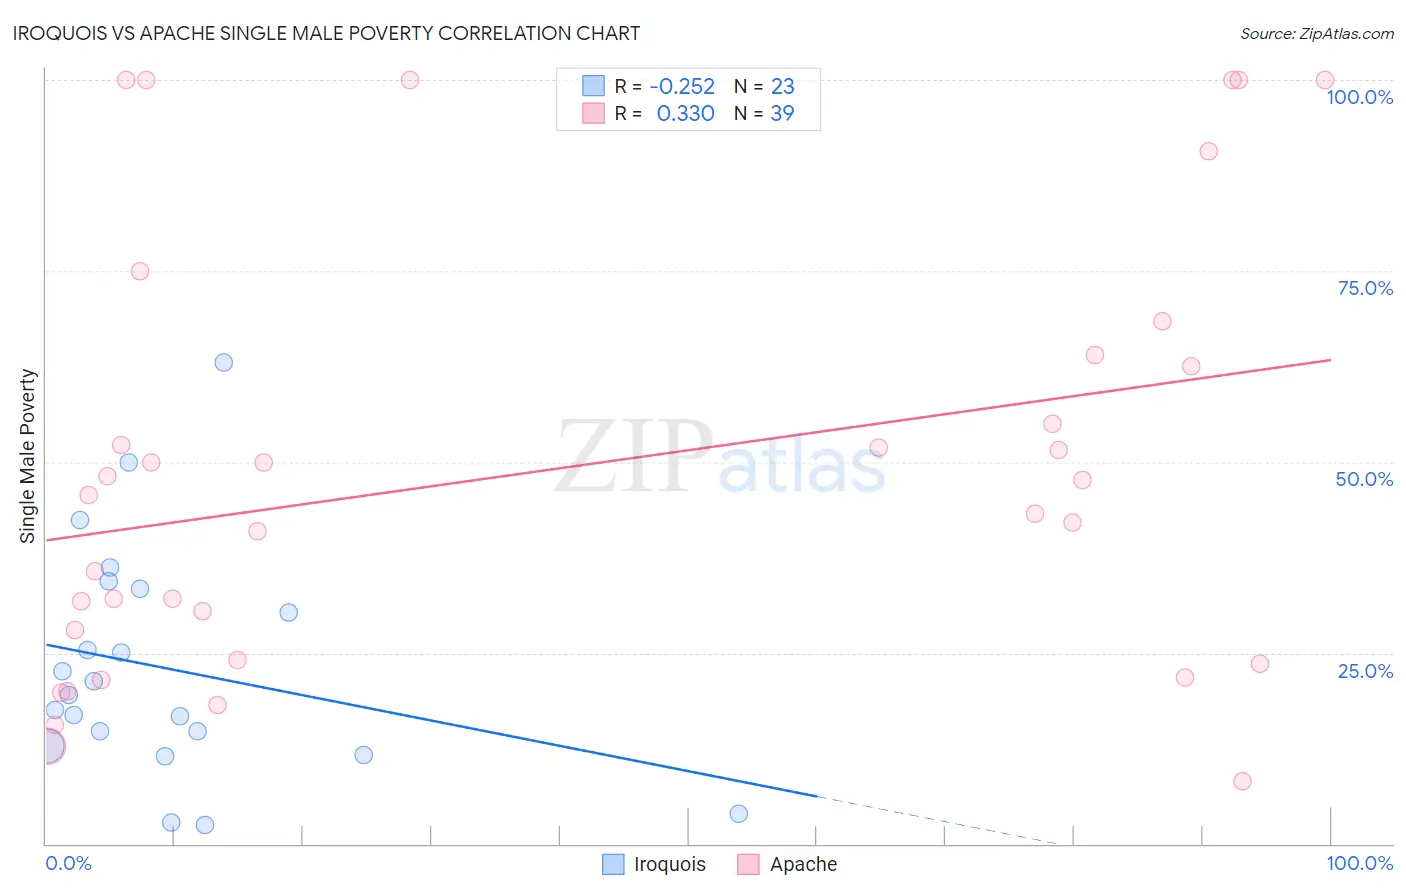
Iroquois vs Apache Single Male Poverty Correlation Chart
The statistical analysis conducted on geographies consisting of 192,366,104 people shows a weak negative correlation between the proportion of Iroquois and poverty level among single males in the United States with a correlation coefficient (R) of -0.252 and weighted average of 14.5%. Similarly, the statistical analysis conducted on geographies consisting of 216,687,885 people shows a mild positive correlation between the proportion of Apache and poverty level among single males in the United States with a correlation coefficient (R) of 0.330 and weighted average of 21.6%, a difference of 48.9%.
Single Male Poverty Correlation Summary
| Measurement | Iroquois | Apache |
| Minimum | 2.4% | 8.2% |
| Maximum | 63.0% | 100.0% |
| Range | 60.6% | 91.8% |
| Mean | 23.0% | 49.1% |
| Median | 19.4% | 45.6% |
| Interquartile 25% (IQ1) | 12.8% | 24.1% |
| Interquartile 75% (IQ3) | 33.3% | 64.0% |
| Interquartile Range (IQR) | 20.5% | 39.9% |
| Standard Deviation (Sample) | 15.1% | 28.3% |
| Standard Deviation (Population) | 14.7% | 27.9% |
Similar Demographics by Single Male Poverty
Demographics Similar to Iroquois by Single Male Poverty
In terms of single male poverty, the demographic groups most similar to Iroquois are White/Caucasian (14.5%, a difference of 0.0%), Immigrants from Dominica (14.5%, a difference of 0.090%), Celtic (14.5%, a difference of 0.13%), U.S. Virgin Islander (14.5%, a difference of 0.32%), and French (14.4%, a difference of 0.45%).
| Demographics | Rating | Rank | Single Male Poverty |
| Hmong | 0.0 /100 | #280 | Tragic 14.2% |
| Hispanics or Latinos | 0.0 /100 | #281 | Tragic 14.2% |
| Spanish Americans | 0.0 /100 | #282 | Tragic 14.2% |
| Yaqui | 0.0 /100 | #283 | Tragic 14.2% |
| Immigrants | Bahamas | 0.0 /100 | #284 | Tragic 14.4% |
| French | 0.0 /100 | #285 | Tragic 14.4% |
| Celtics | 0.0 /100 | #286 | Tragic 14.5% |
| Iroquois | 0.0 /100 | #287 | Tragic 14.5% |
| Whites/Caucasians | 0.0 /100 | #288 | Tragic 14.5% |
| Immigrants | Dominica | 0.0 /100 | #289 | Tragic 14.5% |
| U.S. Virgin Islanders | 0.0 /100 | #290 | Tragic 14.5% |
| Bahamians | 0.0 /100 | #291 | Tragic 14.6% |
| Immigrants | Nonimmigrants | 0.0 /100 | #292 | Tragic 14.6% |
| French Canadians | 0.0 /100 | #293 | Tragic 14.6% |
| Ottawa | 0.0 /100 | #294 | Tragic 14.6% |
Demographics Similar to Apache by Single Male Poverty
In terms of single male poverty, the demographic groups most similar to Apache are Tohono O'odham (21.6%, a difference of 0.10%), Pueblo (21.6%, a difference of 0.18%), Yuman (21.3%, a difference of 1.3%), Arapaho (21.9%, a difference of 1.7%), and Sioux (22.2%, a difference of 2.9%).
| Demographics | Rating | Rank | Single Male Poverty |
| Cajuns | 0.0 /100 | #330 | Tragic 19.1% |
| Paiute | 0.0 /100 | #331 | Tragic 19.3% |
| Natives/Alaskans | 0.0 /100 | #332 | Tragic 19.6% |
| Inupiat | 0.0 /100 | #333 | Tragic 20.0% |
| Pima | 0.0 /100 | #334 | Tragic 20.2% |
| Yuman | 0.0 /100 | #335 | Tragic 21.3% |
| Tohono O'odham | 0.0 /100 | #336 | Tragic 21.6% |
| Apache | 0.0 /100 | #337 | Tragic 21.6% |
| Pueblo | 0.0 /100 | #338 | Tragic 21.6% |
| Arapaho | 0.0 /100 | #339 | Tragic 21.9% |
| Sioux | 0.0 /100 | #340 | Tragic 22.2% |
| Crow | 0.0 /100 | #341 | Tragic 23.3% |
| Houma | 0.0 /100 | #342 | Tragic 23.5% |
| Puerto Ricans | 0.0 /100 | #343 | Tragic 25.1% |
| Lumbee | 0.0 /100 | #344 | Tragic 25.2% |