Guatemalan vs Subsaharan African Births to Unmarried Women
COMPARE
Guatemalan
Subsaharan African
Births to Unmarried Women
Births to Unmarried Women Comparison
Guatemalans
Sub-Saharan Africans
37.1%
BIRTHS TO UNMARRIED WOMEN
0.1/ 100
METRIC RATING
277th/ 347
METRIC RANK
36.7%
BIRTHS TO UNMARRIED WOMEN
0.1/ 100
METRIC RATING
264th/ 347
METRIC RANK
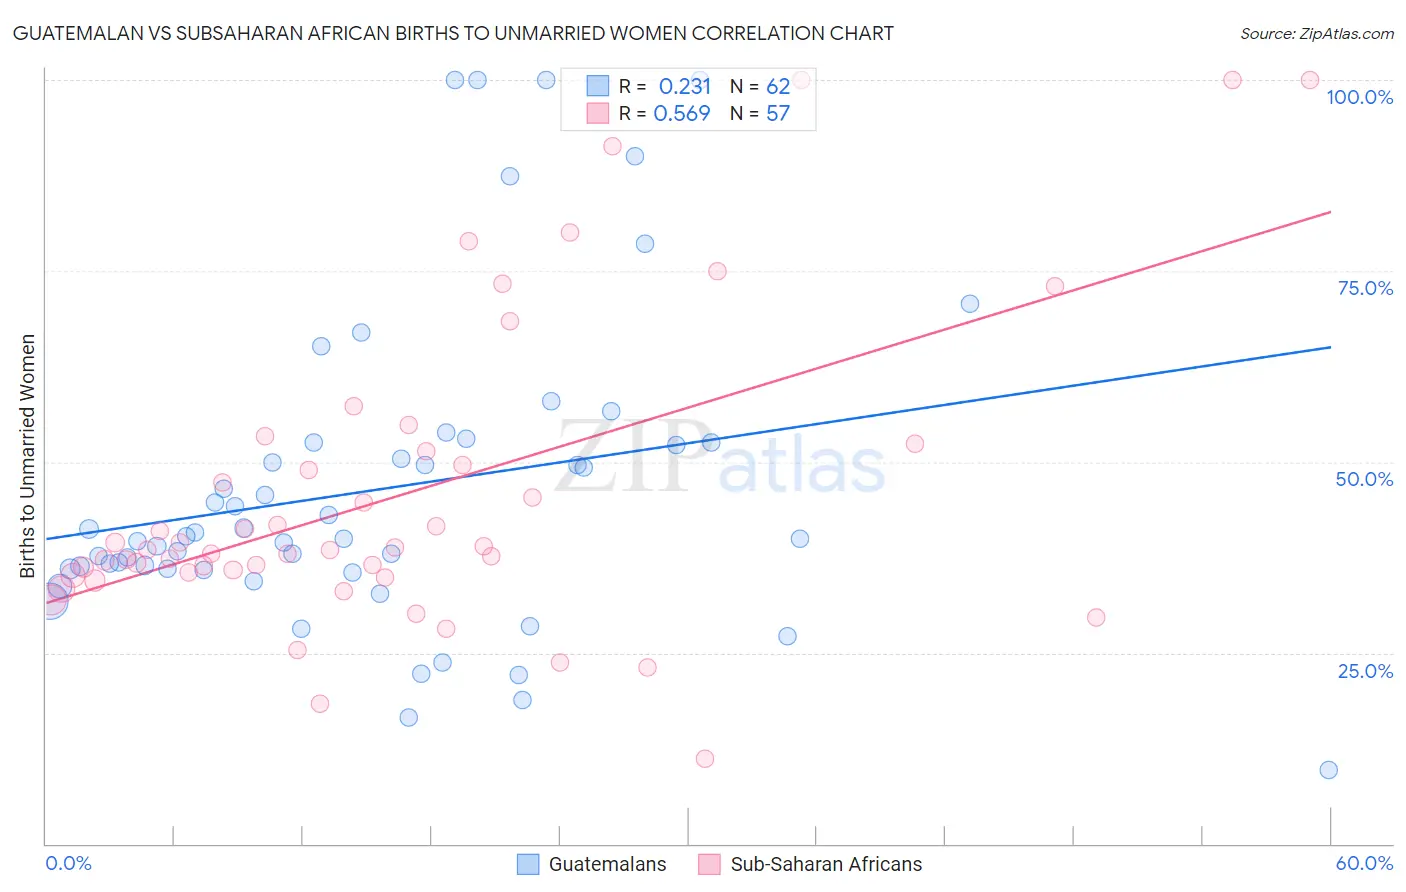
Guatemalan vs Subsaharan African Births to Unmarried Women Correlation Chart
The statistical analysis conducted on geographies consisting of 386,480,931 people shows a weak positive correlation between the proportion of Guatemalans and percentage of births to unmarried women in the United States with a correlation coefficient (R) of 0.231 and weighted average of 37.1%. Similarly, the statistical analysis conducted on geographies consisting of 468,897,335 people shows a substantial positive correlation between the proportion of Sub-Saharan Africans and percentage of births to unmarried women in the United States with a correlation coefficient (R) of 0.569 and weighted average of 36.7%, a difference of 1.3%.
Births to Unmarried Women Correlation Summary
| Measurement | Guatemalan | Subsaharan African |
| Minimum | 9.7% | 11.1% |
| Maximum | 100.0% | 100.0% |
| Range | 90.3% | 88.9% |
| Mean | 46.5% | 45.9% |
| Median | 40.1% | 38.5% |
| Interquartile 25% (IQ1) | 35.9% | 35.3% |
| Interquartile 75% (IQ3) | 52.6% | 51.9% |
| Interquartile Range (IQR) | 16.7% | 16.5% |
| Standard Deviation (Sample) | 20.6% | 20.2% |
| Standard Deviation (Population) | 20.5% | 20.0% |
Demographics Similar to Guatemalans and Sub-Saharan Africans by Births to Unmarried Women
In terms of births to unmarried women, the demographic groups most similar to Guatemalans are Immigrants from Latin America (37.1%, a difference of 0.090%), Belizean (37.0%, a difference of 0.22%), Barbadian (37.0%, a difference of 0.41%), West Indian (37.3%, a difference of 0.42%), and Cree (37.0%, a difference of 0.43%). Similarly, the demographic groups most similar to Sub-Saharan Africans are Cherokee (36.7%, a difference of 0.050%), Immigrants from Senegal (36.7%, a difference of 0.10%), Nicaraguan (36.6%, a difference of 0.12%), French American Indian (36.6%, a difference of 0.14%), and Central American (36.7%, a difference of 0.17%).
| Demographics | Rating | Rank | Births to Unmarried Women |
| Ottawa | 0.2 /100 | #260 | Tragic 36.5% |
| Trinidadians and Tobagonians | 0.2 /100 | #261 | Tragic 36.5% |
| French American Indians | 0.1 /100 | #262 | Tragic 36.6% |
| Nicaraguans | 0.1 /100 | #263 | Tragic 36.6% |
| Sub-Saharan Africans | 0.1 /100 | #264 | Tragic 36.7% |
| Cherokee | 0.1 /100 | #265 | Tragic 36.7% |
| Immigrants | Senegal | 0.1 /100 | #266 | Tragic 36.7% |
| Central Americans | 0.1 /100 | #267 | Tragic 36.7% |
| Comanche | 0.1 /100 | #268 | Tragic 36.7% |
| Senegalese | 0.1 /100 | #269 | Tragic 36.8% |
| Immigrants | Congo | 0.1 /100 | #270 | Tragic 36.8% |
| Immigrants | Barbados | 0.1 /100 | #271 | Tragic 36.8% |
| Choctaw | 0.1 /100 | #272 | Tragic 36.9% |
| Mexicans | 0.1 /100 | #273 | Tragic 36.9% |
| Cree | 0.1 /100 | #274 | Tragic 37.0% |
| Barbadians | 0.1 /100 | #275 | Tragic 37.0% |
| Belizeans | 0.1 /100 | #276 | Tragic 37.0% |
| Guatemalans | 0.1 /100 | #277 | Tragic 37.1% |
| Immigrants | Latin America | 0.1 /100 | #278 | Tragic 37.1% |
| West Indians | 0.1 /100 | #279 | Tragic 37.3% |
| Immigrants | St. Vincent and the Grenadines | 0.1 /100 | #280 | Tragic 37.3% |