Guatemalan vs Subsaharan African Disability Age 35 to 64
COMPARE
Guatemalan
Subsaharan African
Disability Age 35 to 64
Disability Age 35 to 64 Comparison
Guatemalans
Sub-Saharan Africans
11.7%
DISABILITY AGE 35 TO 64
14.6/ 100
METRIC RATING
208th/ 347
METRIC RANK
12.6%
DISABILITY AGE 35 TO 64
0.2/ 100
METRIC RATING
267th/ 347
METRIC RANK
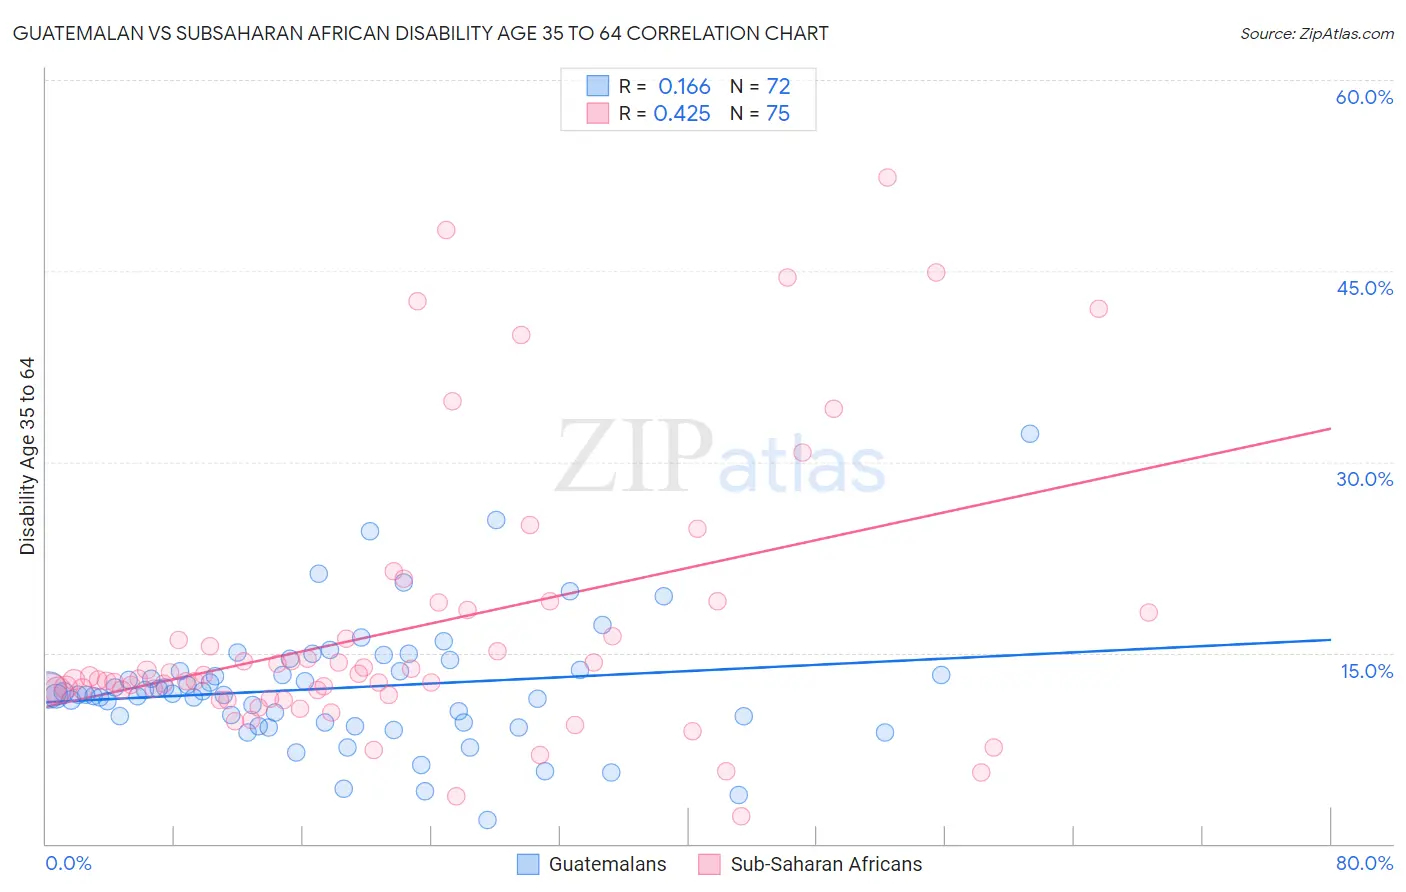
Guatemalan vs Subsaharan African Disability Age 35 to 64 Correlation Chart
The statistical analysis conducted on geographies consisting of 409,236,558 people shows a poor positive correlation between the proportion of Guatemalans and percentage of population with a disability between the ages 34 and 64 in the United States with a correlation coefficient (R) of 0.166 and weighted average of 11.7%. Similarly, the statistical analysis conducted on geographies consisting of 507,479,662 people shows a moderate positive correlation between the proportion of Sub-Saharan Africans and percentage of population with a disability between the ages 34 and 64 in the United States with a correlation coefficient (R) of 0.425 and weighted average of 12.6%, a difference of 8.3%.
Disability Age 35 to 64 Correlation Summary
| Measurement | Guatemalan | Subsaharan African |
| Minimum | 1.8% | 2.2% |
| Maximum | 32.3% | 52.4% |
| Range | 30.4% | 50.2% |
| Mean | 12.2% | 16.8% |
| Median | 11.7% | 12.9% |
| Interquartile 25% (IQ1) | 9.5% | 11.6% |
| Interquartile 75% (IQ3) | 13.6% | 18.2% |
| Interquartile Range (IQR) | 4.1% | 6.5% |
| Standard Deviation (Sample) | 4.9% | 10.7% |
| Standard Deviation (Population) | 4.9% | 10.7% |
Similar Demographics by Disability Age 35 to 64
Demographics Similar to Guatemalans by Disability Age 35 to 64
In terms of disability age 35 to 64, the demographic groups most similar to Guatemalans are Native Hawaiian (11.7%, a difference of 0.030%), Ghanaian (11.7%, a difference of 0.030%), Slavic (11.7%, a difference of 0.13%), European (11.7%, a difference of 0.19%), and Nigerian (11.6%, a difference of 0.25%).
| Demographics | Rating | Rank | Disability Age 35 to 64 |
| Immigrants | Kenya | 17.7 /100 | #201 | Poor 11.6% |
| Immigrants | Guatemala | 17.5 /100 | #202 | Poor 11.6% |
| British | 17.0 /100 | #203 | Poor 11.6% |
| Nigerians | 16.3 /100 | #204 | Poor 11.6% |
| Slavs | 15.5 /100 | #205 | Poor 11.7% |
| Native Hawaiians | 14.8 /100 | #206 | Poor 11.7% |
| Ghanaians | 14.8 /100 | #207 | Poor 11.7% |
| Guatemalans | 14.6 /100 | #208 | Poor 11.7% |
| Europeans | 13.5 /100 | #209 | Poor 11.7% |
| Belgians | 13.1 /100 | #210 | Poor 11.7% |
| Canadians | 13.0 /100 | #211 | Poor 11.7% |
| Immigrants | Jamaica | 11.8 /100 | #212 | Poor 11.7% |
| Yugoslavians | 11.6 /100 | #213 | Poor 11.7% |
| Immigrants | Sudan | 11.4 /100 | #214 | Poor 11.7% |
| Spanish American Indians | 11.1 /100 | #215 | Poor 11.7% |
Demographics Similar to Sub-Saharan Africans by Disability Age 35 to 64
In terms of disability age 35 to 64, the demographic groups most similar to Sub-Saharan Africans are White/Caucasian (12.6%, a difference of 0.16%), Immigrants from Dominica (12.7%, a difference of 0.18%), Spanish (12.7%, a difference of 0.28%), French (12.7%, a difference of 0.33%), and Marshallese (12.5%, a difference of 0.86%).
| Demographics | Rating | Rank | Disability Age 35 to 64 |
| German Russians | 0.5 /100 | #260 | Tragic 12.5% |
| Malaysians | 0.5 /100 | #261 | Tragic 12.5% |
| Senegalese | 0.5 /100 | #262 | Tragic 12.5% |
| Immigrants | Zaire | 0.4 /100 | #263 | Tragic 12.5% |
| Immigrants | Portugal | 0.4 /100 | #264 | Tragic 12.5% |
| Marshallese | 0.4 /100 | #265 | Tragic 12.5% |
| Whites/Caucasians | 0.3 /100 | #266 | Tragic 12.6% |
| Sub-Saharan Africans | 0.2 /100 | #267 | Tragic 12.6% |
| Immigrants | Dominica | 0.2 /100 | #268 | Tragic 12.7% |
| Spanish | 0.2 /100 | #269 | Tragic 12.7% |
| French | 0.2 /100 | #270 | Tragic 12.7% |
| Nepalese | 0.1 /100 | #271 | Tragic 12.8% |
| U.S. Virgin Islanders | 0.1 /100 | #272 | Tragic 12.8% |
| Pennsylvania Germans | 0.1 /100 | #273 | Tragic 12.8% |
| Celtics | 0.1 /100 | #274 | Tragic 12.9% |