Cuban vs Lumbee No Schooling Completed
COMPARE
Cuban
Lumbee
No Schooling Completed
No Schooling Completed Comparison
Cubans
Lumbee
2.5%
NO SCHOOLING COMPLETED
0.2/ 100
METRIC RATING
271st/ 347
METRIC RANK
1.5%
NO SCHOOLING COMPLETED
100.0/ 100
METRIC RATING
29th/ 347
METRIC RANK
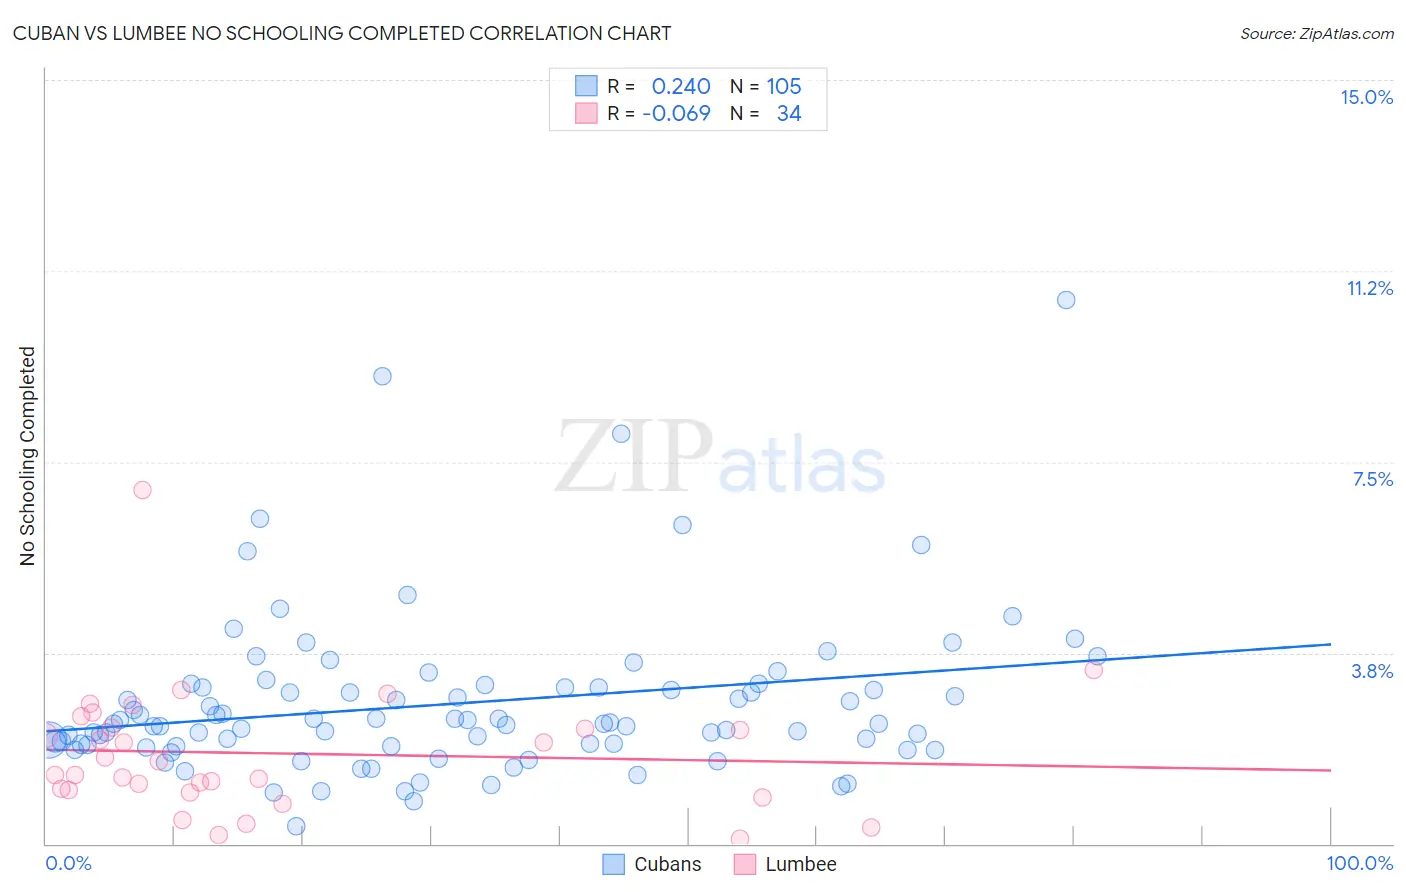
Cuban vs Lumbee No Schooling Completed Correlation Chart
The statistical analysis conducted on geographies consisting of 444,053,579 people shows a weak positive correlation between the proportion of Cubans and percentage of population with no schooling in the United States with a correlation coefficient (R) of 0.240 and weighted average of 2.5%. Similarly, the statistical analysis conducted on geographies consisting of 91,955,229 people shows a slight negative correlation between the proportion of Lumbee and percentage of population with no schooling in the United States with a correlation coefficient (R) of -0.069 and weighted average of 1.5%, a difference of 66.1%.
No Schooling Completed Correlation Summary
| Measurement | Cuban | Lumbee |
| Minimum | 0.33% | 0.093% |
| Maximum | 10.7% | 6.9% |
| Range | 10.4% | 6.9% |
| Mean | 2.8% | 1.8% |
| Median | 2.4% | 1.5% |
| Interquartile 25% (IQ1) | 1.9% | 1.0% |
| Interquartile 75% (IQ3) | 3.1% | 2.3% |
| Interquartile Range (IQR) | 1.1% | 1.2% |
| Standard Deviation (Sample) | 1.6% | 1.3% |
| Standard Deviation (Population) | 1.6% | 1.2% |
Similar Demographics by No Schooling Completed
Demographics Similar to Cubans by No Schooling Completed
In terms of no schooling completed, the demographic groups most similar to Cubans are Immigrants from Peru (2.5%, a difference of 0.010%), Immigrants from Nigeria (2.5%, a difference of 0.090%), Immigrants from Bolivia (2.5%, a difference of 0.53%), Taiwanese (2.5%, a difference of 0.95%), and Yuman (2.5%, a difference of 1.2%).
| Demographics | Rating | Rank | No Schooling Completed |
| Indians (Asian) | 0.4 /100 | #264 | Tragic 2.5% |
| West Indians | 0.4 /100 | #265 | Tragic 2.5% |
| Fijians | 0.4 /100 | #266 | Tragic 2.5% |
| Yuman | 0.4 /100 | #267 | Tragic 2.5% |
| Taiwanese | 0.3 /100 | #268 | Tragic 2.5% |
| Immigrants | Nigeria | 0.2 /100 | #269 | Tragic 2.5% |
| Immigrants | Peru | 0.2 /100 | #270 | Tragic 2.5% |
| Cubans | 0.2 /100 | #271 | Tragic 2.5% |
| Immigrants | Bolivia | 0.2 /100 | #272 | Tragic 2.5% |
| Immigrants | Cameroon | 0.1 /100 | #273 | Tragic 2.5% |
| Ghanaians | 0.1 /100 | #274 | Tragic 2.6% |
| Immigrants | China | 0.1 /100 | #275 | Tragic 2.6% |
| Immigrants | Western Africa | 0.1 /100 | #276 | Tragic 2.6% |
| Immigrants | Philippines | 0.1 /100 | #277 | Tragic 2.6% |
| Immigrants | Uzbekistan | 0.1 /100 | #278 | Tragic 2.6% |
Demographics Similar to Lumbee by No Schooling Completed
In terms of no schooling completed, the demographic groups most similar to Lumbee are British (1.5%, a difference of 0.48%), Inupiat (1.5%, a difference of 0.51%), French Canadian (1.5%, a difference of 0.91%), Swiss (1.5%, a difference of 0.91%), and Scandinavian (1.5%, a difference of 0.92%).
| Demographics | Rating | Rank | No Schooling Completed |
| Alaska Natives | 100.0 /100 | #22 | Exceptional 1.5% |
| Europeans | 100.0 /100 | #23 | Exceptional 1.5% |
| Pennsylvania Germans | 100.0 /100 | #24 | Exceptional 1.5% |
| French | 100.0 /100 | #25 | Exceptional 1.5% |
| Czechs | 100.0 /100 | #26 | Exceptional 1.5% |
| Scandinavians | 100.0 /100 | #27 | Exceptional 1.5% |
| French Canadians | 100.0 /100 | #28 | Exceptional 1.5% |
| Lumbee | 100.0 /100 | #29 | Exceptional 1.5% |
| British | 100.0 /100 | #30 | Exceptional 1.5% |
| Inupiat | 100.0 /100 | #31 | Exceptional 1.5% |
| Swiss | 100.0 /100 | #32 | Exceptional 1.5% |
| Italians | 100.0 /100 | #33 | Exceptional 1.5% |
| Latvians | 100.0 /100 | #34 | Exceptional 1.5% |
| Eastern Europeans | 100.0 /100 | #35 | Exceptional 1.6% |
| Aleuts | 99.9 /100 | #36 | Exceptional 1.6% |