Cuban vs Lumbee Single Mother Poverty
COMPARE
Cuban
Lumbee
Single Mother Poverty
Single Mother Poverty Comparison
Cubans
Lumbee
29.6%
SINGLE MOTHER POVERTY
20.8/ 100
METRIC RATING
199th/ 347
METRIC RANK
43.2%
SINGLE MOTHER POVERTY
0.0/ 100
METRIC RATING
345th/ 347
METRIC RANK
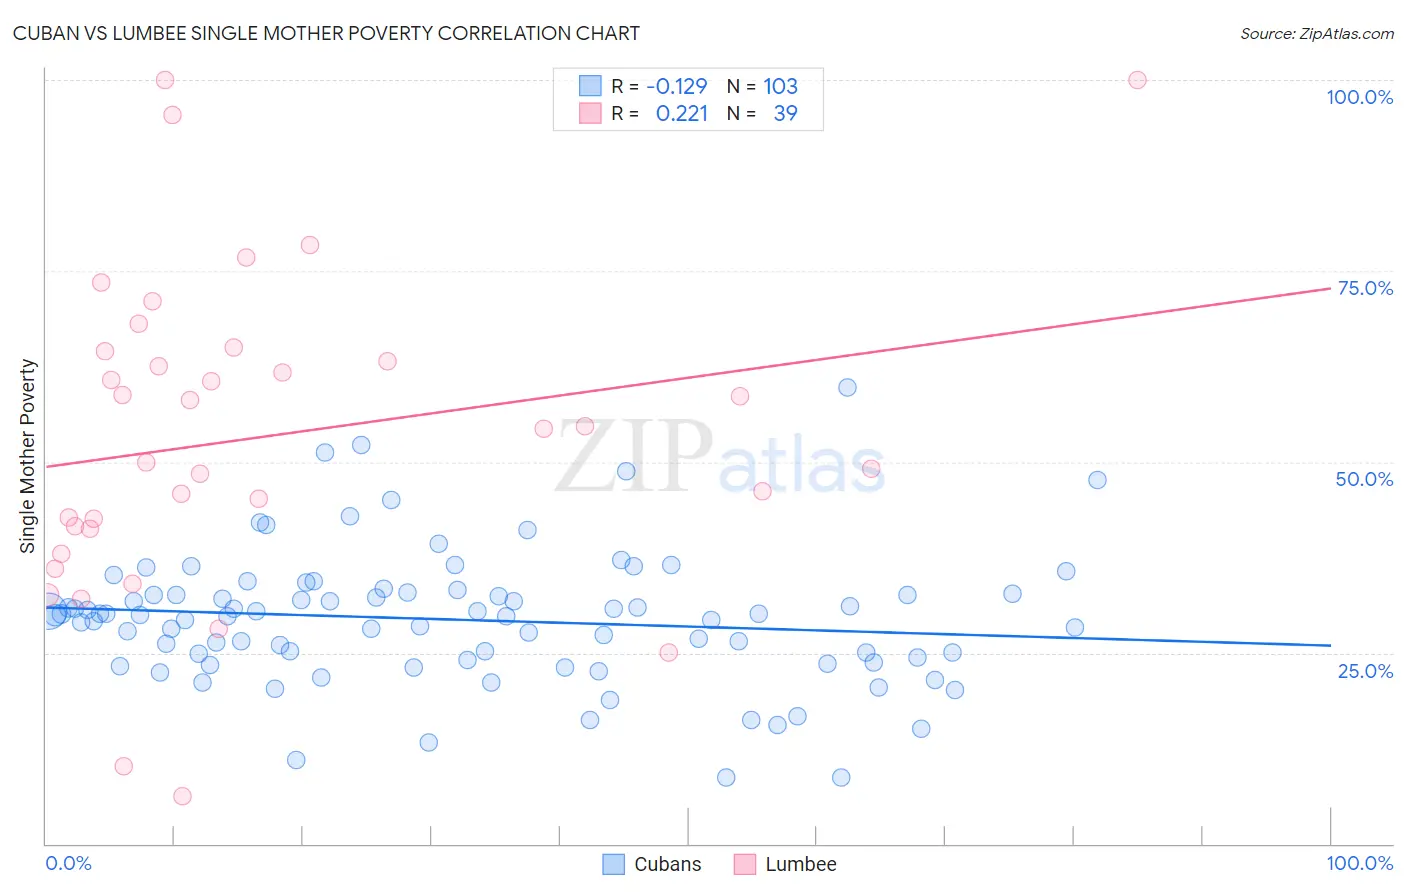
Cuban vs Lumbee Single Mother Poverty Correlation Chart
The statistical analysis conducted on geographies consisting of 437,360,929 people shows a poor negative correlation between the proportion of Cubans and poverty level among single mothers in the United States with a correlation coefficient (R) of -0.129 and weighted average of 29.6%. Similarly, the statistical analysis conducted on geographies consisting of 91,530,918 people shows a weak positive correlation between the proportion of Lumbee and poverty level among single mothers in the United States with a correlation coefficient (R) of 0.221 and weighted average of 43.2%, a difference of 45.9%.
Single Mother Poverty Correlation Summary
| Measurement | Cuban | Lumbee |
| Minimum | 8.7% | 6.2% |
| Maximum | 59.8% | 100.0% |
| Range | 51.1% | 93.8% |
| Mean | 29.3% | 53.4% |
| Median | 29.9% | 54.4% |
| Interquartile 25% (IQ1) | 24.0% | 41.2% |
| Interquartile 75% (IQ3) | 32.7% | 64.5% |
| Interquartile Range (IQR) | 8.7% | 23.4% |
| Standard Deviation (Sample) | 8.7% | 21.1% |
| Standard Deviation (Population) | 8.7% | 20.9% |
Similar Demographics by Single Mother Poverty
Demographics Similar to Cubans by Single Mother Poverty
In terms of single mother poverty, the demographic groups most similar to Cubans are Panamanian (29.6%, a difference of 0.050%), Trinidadian and Tobagonian (29.6%, a difference of 0.070%), Immigrants from Jamaica (29.6%, a difference of 0.080%), Belgian (29.7%, a difference of 0.15%), and Spanish American Indian (29.6%, a difference of 0.18%).
| Demographics | Rating | Rank | Single Mother Poverty |
| Moroccans | 28.6 /100 | #192 | Fair 29.5% |
| Basques | 28.3 /100 | #193 | Fair 29.5% |
| Icelanders | 26.1 /100 | #194 | Fair 29.5% |
| Slavs | 24.5 /100 | #195 | Fair 29.6% |
| Spanish American Indians | 23.4 /100 | #196 | Fair 29.6% |
| Immigrants | Jamaica | 22.0 /100 | #197 | Fair 29.6% |
| Trinidadians and Tobagonians | 21.7 /100 | #198 | Fair 29.6% |
| Cubans | 20.8 /100 | #199 | Fair 29.6% |
| Panamanians | 20.0 /100 | #200 | Fair 29.6% |
| Belgians | 18.8 /100 | #201 | Poor 29.7% |
| Malaysians | 17.4 /100 | #202 | Poor 29.7% |
| Swiss | 17.2 /100 | #203 | Poor 29.7% |
| Immigrants | Immigrants | 16.6 /100 | #204 | Poor 29.7% |
| Czechoslovakians | 16.1 /100 | #205 | Poor 29.7% |
| Immigrants | Haiti | 15.8 /100 | #206 | Poor 29.7% |
Demographics Similar to Lumbee by Single Mother Poverty
In terms of single mother poverty, the demographic groups most similar to Lumbee are Tohono O'odham (43.0%, a difference of 0.49%), Houma (43.5%, a difference of 0.62%), Puerto Rican (44.5%, a difference of 3.0%), Cajun (40.3%, a difference of 7.2%), and Navajo (40.2%, a difference of 7.5%).
| Demographics | Rating | Rank | Single Mother Poverty |
| Menominee | 0.0 /100 | #333 | Tragic 37.1% |
| Pueblo | 0.0 /100 | #334 | Tragic 37.2% |
| Yuman | 0.0 /100 | #335 | Tragic 37.8% |
| Cheyenne | 0.0 /100 | #336 | Tragic 38.5% |
| Immigrants | Yemen | 0.0 /100 | #337 | Tragic 38.5% |
| Pima | 0.0 /100 | #338 | Tragic 38.6% |
| Crow | 0.0 /100 | #339 | Tragic 38.6% |
| Sioux | 0.0 /100 | #340 | Tragic 38.8% |
| Colville | 0.0 /100 | #341 | Tragic 39.3% |
| Navajo | 0.0 /100 | #342 | Tragic 40.2% |
| Cajuns | 0.0 /100 | #343 | Tragic 40.3% |
| Tohono O'odham | 0.0 /100 | #344 | Tragic 43.0% |
| Lumbee | 0.0 /100 | #345 | Tragic 43.2% |
| Houma | 0.0 /100 | #346 | Tragic 43.5% |
| Puerto Ricans | 0.0 /100 | #347 | Tragic 44.5% |