Immigrants from Ghana vs Immigrants from Ethiopia Poverty
COMPARE
Immigrants from Ghana
Immigrants from Ethiopia
Poverty
Poverty Comparison
Immigrants from Ghana
Immigrants from Ethiopia
14.2%
POVERTY
0.2/ 100
METRIC RATING
249th/ 347
METRIC RANK
12.2%
POVERTY
58.6/ 100
METRIC RATING
163rd/ 347
METRIC RANK
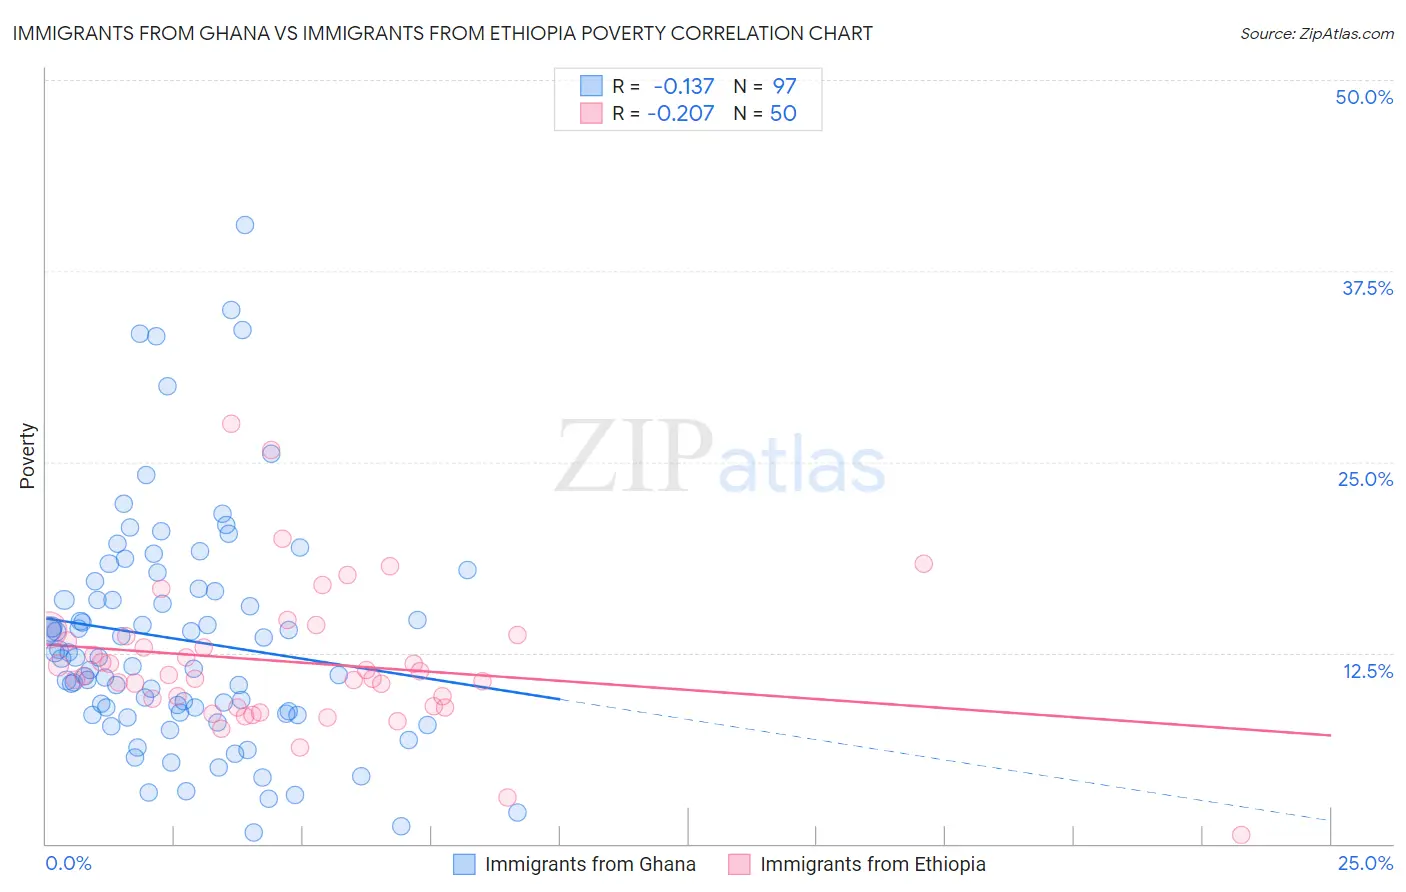
Immigrants from Ghana vs Immigrants from Ethiopia Poverty Correlation Chart
The statistical analysis conducted on geographies consisting of 199,808,032 people shows a poor negative correlation between the proportion of Immigrants from Ghana and poverty level in the United States with a correlation coefficient (R) of -0.137 and weighted average of 14.2%. Similarly, the statistical analysis conducted on geographies consisting of 211,460,176 people shows a weak negative correlation between the proportion of Immigrants from Ethiopia and poverty level in the United States with a correlation coefficient (R) of -0.207 and weighted average of 12.2%, a difference of 15.9%.
Poverty Correlation Summary
| Measurement | Immigrants from Ghana | Immigrants from Ethiopia |
| Minimum | 0.71% | 0.57% |
| Maximum | 40.5% | 27.5% |
| Range | 39.8% | 26.9% |
| Mean | 13.4% | 11.9% |
| Median | 12.2% | 11.0% |
| Interquartile 25% (IQ1) | 8.5% | 9.0% |
| Interquartile 75% (IQ3) | 16.6% | 13.6% |
| Interquartile Range (IQR) | 8.1% | 4.6% |
| Standard Deviation (Sample) | 7.6% | 4.7% |
| Standard Deviation (Population) | 7.5% | 4.6% |
Similar Demographics by Poverty
Demographics Similar to Immigrants from Ghana by Poverty
In terms of poverty, the demographic groups most similar to Immigrants from Ghana are Immigrants from Western Africa (14.1%, a difference of 0.090%), Liberian (14.1%, a difference of 0.11%), Cree (14.2%, a difference of 0.30%), Immigrants from Burma/Myanmar (14.2%, a difference of 0.39%), and Potawatomi (14.1%, a difference of 0.40%).
| Demographics | Rating | Rank | Poverty |
| Ecuadorians | 0.4 /100 | #242 | Tragic 14.0% |
| Sudanese | 0.3 /100 | #243 | Tragic 14.0% |
| Nepalese | 0.3 /100 | #244 | Tragic 14.0% |
| Immigrants | Sudan | 0.3 /100 | #245 | Tragic 14.1% |
| Potawatomi | 0.3 /100 | #246 | Tragic 14.1% |
| Liberians | 0.2 /100 | #247 | Tragic 14.1% |
| Immigrants | Western Africa | 0.2 /100 | #248 | Tragic 14.1% |
| Immigrants | Ghana | 0.2 /100 | #249 | Tragic 14.2% |
| Cree | 0.2 /100 | #250 | Tragic 14.2% |
| Immigrants | Burma/Myanmar | 0.2 /100 | #251 | Tragic 14.2% |
| Spanish American Indians | 0.2 /100 | #252 | Tragic 14.2% |
| Immigrants | Trinidad and Tobago | 0.2 /100 | #253 | Tragic 14.2% |
| Immigrants | El Salvador | 0.1 /100 | #254 | Tragic 14.3% |
| Immigrants | Ecuador | 0.1 /100 | #255 | Tragic 14.3% |
| Mexican American Indians | 0.1 /100 | #256 | Tragic 14.3% |
Demographics Similar to Immigrants from Ethiopia by Poverty
In terms of poverty, the demographic groups most similar to Immigrants from Ethiopia are Ethiopian (12.2%, a difference of 0.050%), Immigrants from Fiji (12.2%, a difference of 0.060%), Colombian (12.2%, a difference of 0.070%), Immigrants from Albania (12.2%, a difference of 0.080%), and Venezuelan (12.2%, a difference of 0.17%).
| Demographics | Rating | Rank | Poverty |
| Scotch-Irish | 62.6 /100 | #156 | Good 12.2% |
| Costa Ricans | 62.2 /100 | #157 | Good 12.2% |
| Taiwanese | 61.8 /100 | #158 | Good 12.2% |
| Pennsylvania Germans | 60.8 /100 | #159 | Good 12.2% |
| Immigrants | Nepal | 60.4 /100 | #160 | Good 12.2% |
| Immigrants | Fiji | 59.1 /100 | #161 | Average 12.2% |
| Ethiopians | 59.1 /100 | #162 | Average 12.2% |
| Immigrants | Ethiopia | 58.6 /100 | #163 | Average 12.2% |
| Colombians | 57.8 /100 | #164 | Average 12.2% |
| Immigrants | Albania | 57.7 /100 | #165 | Average 12.2% |
| Venezuelans | 56.9 /100 | #166 | Average 12.2% |
| Immigrants | Chile | 56.7 /100 | #167 | Average 12.2% |
| Immigrants | Venezuela | 56.5 /100 | #168 | Average 12.2% |
| Whites/Caucasians | 55.4 /100 | #169 | Average 12.3% |
| Immigrants | Oceania | 54.6 /100 | #170 | Average 12.3% |