Immigrants from Northern Europe vs Immigrants from Ethiopia Poverty
COMPARE
Immigrants from Northern Europe
Immigrants from Ethiopia
Poverty
Poverty Comparison
Immigrants from Northern Europe
Immigrants from Ethiopia
10.7%
POVERTY
99.6/ 100
METRIC RATING
27th/ 347
METRIC RANK
12.2%
POVERTY
58.6/ 100
METRIC RATING
163rd/ 347
METRIC RANK
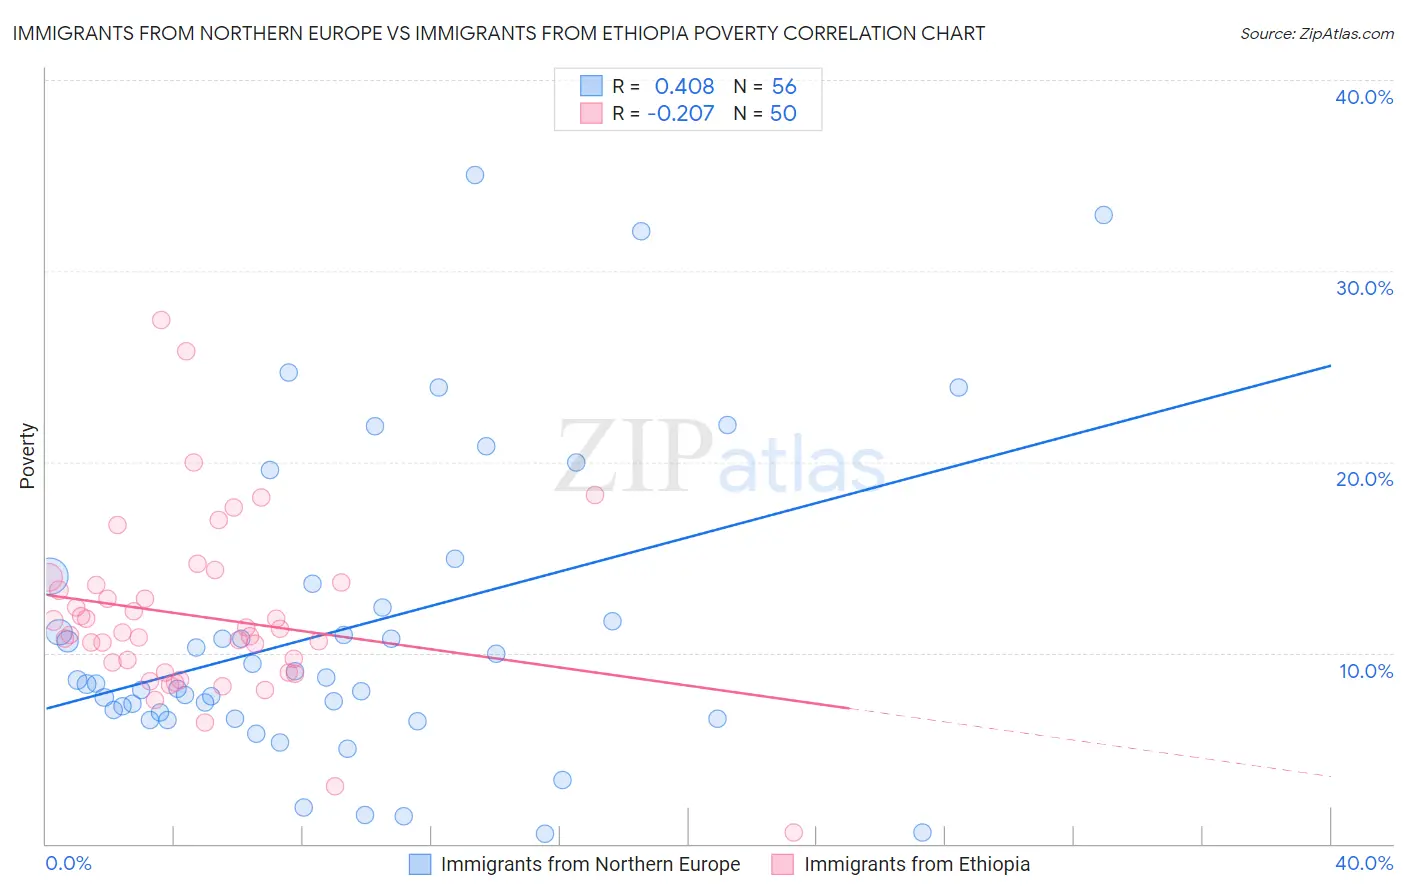
Immigrants from Northern Europe vs Immigrants from Ethiopia Poverty Correlation Chart
The statistical analysis conducted on geographies consisting of 476,900,751 people shows a moderate positive correlation between the proportion of Immigrants from Northern Europe and poverty level in the United States with a correlation coefficient (R) of 0.408 and weighted average of 10.7%. Similarly, the statistical analysis conducted on geographies consisting of 211,460,176 people shows a weak negative correlation between the proportion of Immigrants from Ethiopia and poverty level in the United States with a correlation coefficient (R) of -0.207 and weighted average of 12.2%, a difference of 14.1%.
Poverty Correlation Summary
| Measurement | Immigrants from Northern Europe | Immigrants from Ethiopia |
| Minimum | 0.52% | 0.57% |
| Maximum | 35.0% | 27.5% |
| Range | 34.5% | 26.9% |
| Mean | 11.2% | 11.9% |
| Median | 8.5% | 11.0% |
| Interquartile 25% (IQ1) | 6.7% | 9.0% |
| Interquartile 75% (IQ3) | 13.0% | 13.6% |
| Interquartile Range (IQR) | 6.3% | 4.6% |
| Standard Deviation (Sample) | 7.9% | 4.7% |
| Standard Deviation (Population) | 7.9% | 4.6% |
Similar Demographics by Poverty
Demographics Similar to Immigrants from Northern Europe by Poverty
In terms of poverty, the demographic groups most similar to Immigrants from Northern Europe are Immigrants from Korea (10.7%, a difference of 0.070%), Greek (10.7%, a difference of 0.16%), Danish (10.7%, a difference of 0.17%), Polish (10.7%, a difference of 0.25%), and Iranian (10.7%, a difference of 0.34%).
| Demographics | Rating | Rank | Poverty |
| Immigrants | North Macedonia | 99.7 /100 | #20 | Exceptional 10.6% |
| Luxembourgers | 99.7 /100 | #21 | Exceptional 10.6% |
| Eastern Europeans | 99.7 /100 | #22 | Exceptional 10.6% |
| Swedes | 99.7 /100 | #23 | Exceptional 10.6% |
| Italians | 99.7 /100 | #24 | Exceptional 10.6% |
| Croatians | 99.6 /100 | #25 | Exceptional 10.6% |
| Burmese | 99.6 /100 | #26 | Exceptional 10.7% |
| Immigrants | Northern Europe | 99.6 /100 | #27 | Exceptional 10.7% |
| Immigrants | Korea | 99.5 /100 | #28 | Exceptional 10.7% |
| Greeks | 99.5 /100 | #29 | Exceptional 10.7% |
| Danes | 99.5 /100 | #30 | Exceptional 10.7% |
| Poles | 99.5 /100 | #31 | Exceptional 10.7% |
| Iranians | 99.5 /100 | #32 | Exceptional 10.7% |
| Macedonians | 99.4 /100 | #33 | Exceptional 10.8% |
| Immigrants | Poland | 99.4 /100 | #34 | Exceptional 10.8% |
Demographics Similar to Immigrants from Ethiopia by Poverty
In terms of poverty, the demographic groups most similar to Immigrants from Ethiopia are Ethiopian (12.2%, a difference of 0.050%), Immigrants from Fiji (12.2%, a difference of 0.060%), Colombian (12.2%, a difference of 0.070%), Immigrants from Albania (12.2%, a difference of 0.080%), and Venezuelan (12.2%, a difference of 0.17%).
| Demographics | Rating | Rank | Poverty |
| Scotch-Irish | 62.6 /100 | #156 | Good 12.2% |
| Costa Ricans | 62.2 /100 | #157 | Good 12.2% |
| Taiwanese | 61.8 /100 | #158 | Good 12.2% |
| Pennsylvania Germans | 60.8 /100 | #159 | Good 12.2% |
| Immigrants | Nepal | 60.4 /100 | #160 | Good 12.2% |
| Immigrants | Fiji | 59.1 /100 | #161 | Average 12.2% |
| Ethiopians | 59.1 /100 | #162 | Average 12.2% |
| Immigrants | Ethiopia | 58.6 /100 | #163 | Average 12.2% |
| Colombians | 57.8 /100 | #164 | Average 12.2% |
| Immigrants | Albania | 57.7 /100 | #165 | Average 12.2% |
| Venezuelans | 56.9 /100 | #166 | Average 12.2% |
| Immigrants | Chile | 56.7 /100 | #167 | Average 12.2% |
| Immigrants | Venezuela | 56.5 /100 | #168 | Average 12.2% |
| Whites/Caucasians | 55.4 /100 | #169 | Average 12.3% |
| Immigrants | Oceania | 54.6 /100 | #170 | Average 12.3% |