Basque vs Immigrants from Ethiopia Poverty
COMPARE
Basque
Immigrants from Ethiopia
Poverty
Poverty Comparison
Basques
Immigrants from Ethiopia
11.9%
POVERTY
80.4/ 100
METRIC RATING
142nd/ 347
METRIC RANK
12.2%
POVERTY
58.6/ 100
METRIC RATING
163rd/ 347
METRIC RANK
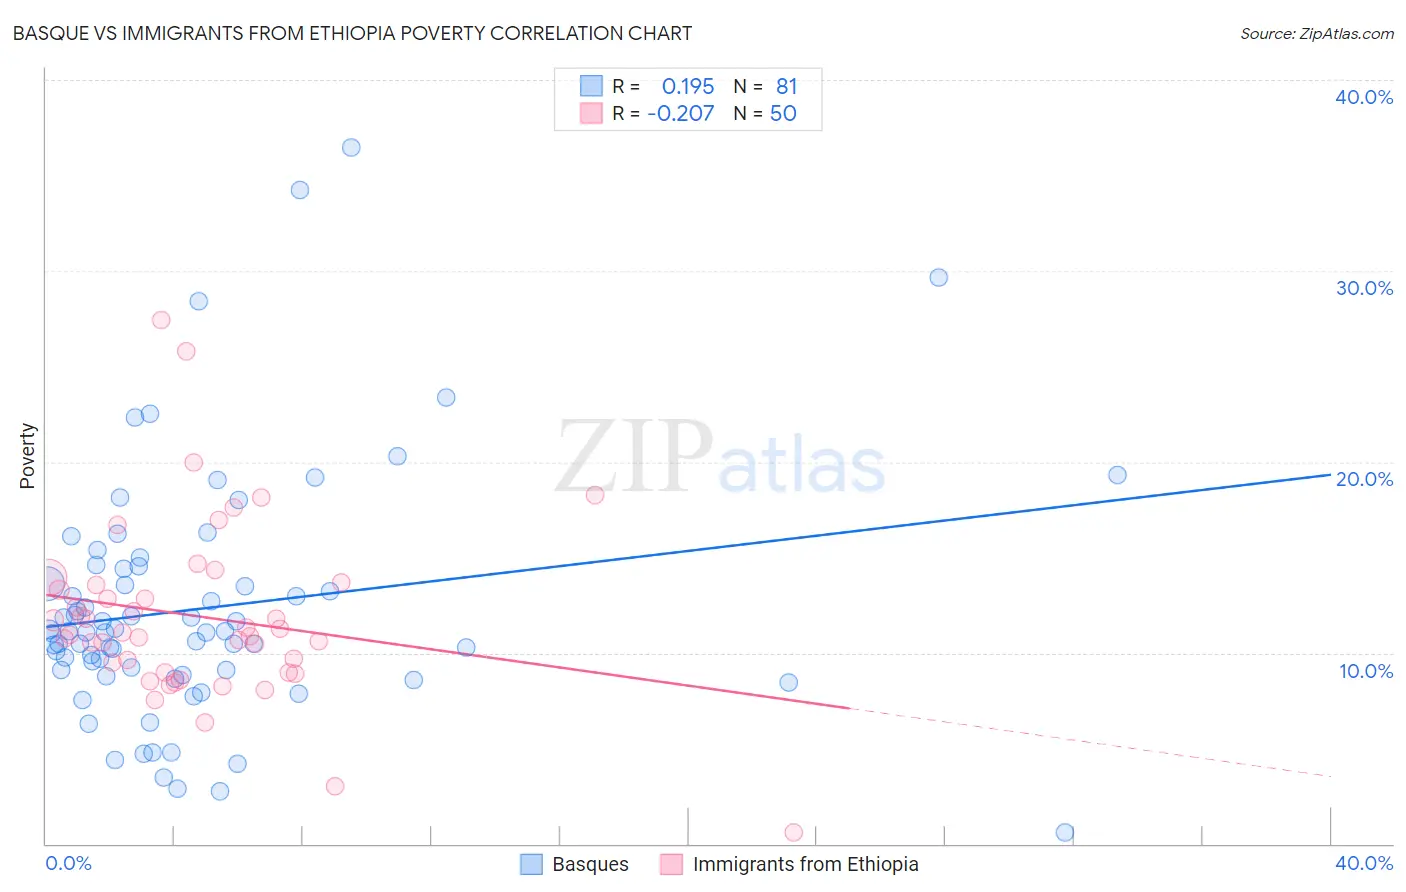
Basque vs Immigrants from Ethiopia Poverty Correlation Chart
The statistical analysis conducted on geographies consisting of 165,732,403 people shows a poor positive correlation between the proportion of Basques and poverty level in the United States with a correlation coefficient (R) of 0.195 and weighted average of 11.9%. Similarly, the statistical analysis conducted on geographies consisting of 211,460,176 people shows a weak negative correlation between the proportion of Immigrants from Ethiopia and poverty level in the United States with a correlation coefficient (R) of -0.207 and weighted average of 12.2%, a difference of 2.7%.
Poverty Correlation Summary
| Measurement | Basque | Immigrants from Ethiopia |
| Minimum | 0.59% | 0.57% |
| Maximum | 36.5% | 27.5% |
| Range | 35.9% | 26.9% |
| Mean | 12.3% | 11.9% |
| Median | 11.1% | 11.0% |
| Interquartile 25% (IQ1) | 9.0% | 9.0% |
| Interquartile 75% (IQ3) | 14.5% | 13.6% |
| Interquartile Range (IQR) | 5.5% | 4.6% |
| Standard Deviation (Sample) | 6.4% | 4.7% |
| Standard Deviation (Population) | 6.4% | 4.6% |
Similar Demographics by Poverty
Demographics Similar to Basques by Poverty
In terms of poverty, the demographic groups most similar to Basques are Immigrants from France (11.9%, a difference of 0.020%), Immigrants from Peru (11.9%, a difference of 0.11%), Brazilian (11.9%, a difference of 0.11%), Pakistani (11.9%, a difference of 0.30%), and Immigrants from Jordan (11.9%, a difference of 0.32%).
| Demographics | Rating | Rank | Poverty |
| Immigrants | Vietnam | 85.2 /100 | #135 | Excellent 11.8% |
| Chileans | 84.2 /100 | #136 | Excellent 11.8% |
| Immigrants | Switzerland | 83.0 /100 | #137 | Excellent 11.8% |
| Immigrants | Jordan | 82.4 /100 | #138 | Excellent 11.9% |
| Pakistanis | 82.2 /100 | #139 | Excellent 11.9% |
| Immigrants | Peru | 81.1 /100 | #140 | Excellent 11.9% |
| Immigrants | France | 80.5 /100 | #141 | Excellent 11.9% |
| Basques | 80.4 /100 | #142 | Excellent 11.9% |
| Brazilians | 79.7 /100 | #143 | Good 11.9% |
| Icelanders | 77.9 /100 | #144 | Good 11.9% |
| Syrians | 75.1 /100 | #145 | Good 12.0% |
| Afghans | 74.9 /100 | #146 | Good 12.0% |
| Immigrants | Bosnia and Herzegovina | 73.7 /100 | #147 | Good 12.0% |
| Immigrants | Germany | 72.7 /100 | #148 | Good 12.0% |
| Immigrants | Malaysia | 72.7 /100 | #149 | Good 12.0% |
Demographics Similar to Immigrants from Ethiopia by Poverty
In terms of poverty, the demographic groups most similar to Immigrants from Ethiopia are Ethiopian (12.2%, a difference of 0.050%), Immigrants from Fiji (12.2%, a difference of 0.060%), Colombian (12.2%, a difference of 0.070%), Immigrants from Albania (12.2%, a difference of 0.080%), and Venezuelan (12.2%, a difference of 0.17%).
| Demographics | Rating | Rank | Poverty |
| Scotch-Irish | 62.6 /100 | #156 | Good 12.2% |
| Costa Ricans | 62.2 /100 | #157 | Good 12.2% |
| Taiwanese | 61.8 /100 | #158 | Good 12.2% |
| Pennsylvania Germans | 60.8 /100 | #159 | Good 12.2% |
| Immigrants | Nepal | 60.4 /100 | #160 | Good 12.2% |
| Immigrants | Fiji | 59.1 /100 | #161 | Average 12.2% |
| Ethiopians | 59.1 /100 | #162 | Average 12.2% |
| Immigrants | Ethiopia | 58.6 /100 | #163 | Average 12.2% |
| Colombians | 57.8 /100 | #164 | Average 12.2% |
| Immigrants | Albania | 57.7 /100 | #165 | Average 12.2% |
| Venezuelans | 56.9 /100 | #166 | Average 12.2% |
| Immigrants | Chile | 56.7 /100 | #167 | Average 12.2% |
| Immigrants | Venezuela | 56.5 /100 | #168 | Average 12.2% |
| Whites/Caucasians | 55.4 /100 | #169 | Average 12.3% |
| Immigrants | Oceania | 54.6 /100 | #170 | Average 12.3% |