Immigrants from St. Vincent and the Grenadines vs Alaska Native Poverty
COMPARE
Immigrants from St. Vincent and the Grenadines
Alaska Native
Poverty
Poverty Comparison
Immigrants from St. Vincent and the Grenadines
Alaska Natives
14.9%
POVERTY
0.0/ 100
METRIC RATING
279th/ 347
METRIC RANK
13.5%
POVERTY
2.1/ 100
METRIC RATING
227th/ 347
METRIC RANK
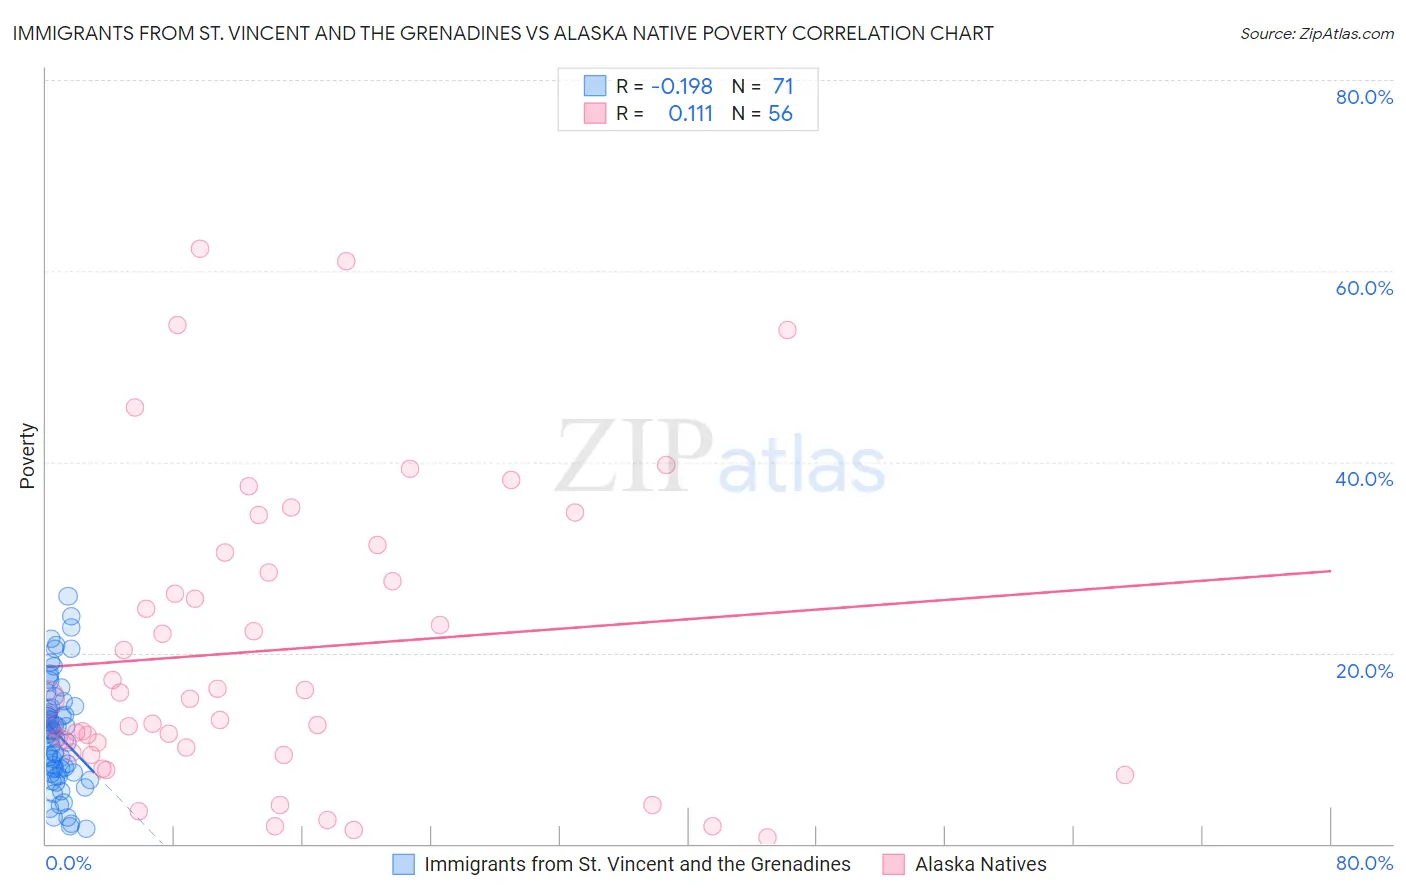
Immigrants from St. Vincent and the Grenadines vs Alaska Native Poverty Correlation Chart
The statistical analysis conducted on geographies consisting of 56,091,353 people shows a poor negative correlation between the proportion of Immigrants from St. Vincent and the Grenadines and poverty level in the United States with a correlation coefficient (R) of -0.198 and weighted average of 14.9%. Similarly, the statistical analysis conducted on geographies consisting of 76,760,249 people shows a poor positive correlation between the proportion of Alaska Natives and poverty level in the United States with a correlation coefficient (R) of 0.111 and weighted average of 13.5%, a difference of 10.3%.
Poverty Correlation Summary
| Measurement | Immigrants from St. Vincent and the Grenadines | Alaska Native |
| Minimum | 1.6% | 0.63% |
| Maximum | 25.9% | 62.3% |
| Range | 24.3% | 61.6% |
| Mean | 11.5% | 20.3% |
| Median | 11.5% | 15.2% |
| Interquartile 25% (IQ1) | 7.5% | 9.8% |
| Interquartile 75% (IQ3) | 14.2% | 29.5% |
| Interquartile Range (IQR) | 6.7% | 19.7% |
| Standard Deviation (Sample) | 5.5% | 15.5% |
| Standard Deviation (Population) | 5.5% | 15.4% |
Similar Demographics by Poverty
Demographics Similar to Immigrants from St. Vincent and the Grenadines by Poverty
In terms of poverty, the demographic groups most similar to Immigrants from St. Vincent and the Grenadines are Haitian (14.9%, a difference of 0.20%), Immigrants from Barbados (14.9%, a difference of 0.27%), Belizean (14.8%, a difference of 0.29%), Bangladeshi (14.8%, a difference of 0.31%), and Immigrants from West Indies (14.8%, a difference of 0.37%).
| Demographics | Rating | Rank | Poverty |
| Chickasaw | 0.0 /100 | #272 | Tragic 14.7% |
| Spanish Americans | 0.0 /100 | #273 | Tragic 14.7% |
| Barbadians | 0.0 /100 | #274 | Tragic 14.8% |
| Immigrants | West Indies | 0.0 /100 | #275 | Tragic 14.8% |
| Immigrants | Bahamas | 0.0 /100 | #276 | Tragic 14.8% |
| Bangladeshis | 0.0 /100 | #277 | Tragic 14.8% |
| Belizeans | 0.0 /100 | #278 | Tragic 14.8% |
| Immigrants | St. Vincent and the Grenadines | 0.0 /100 | #279 | Tragic 14.9% |
| Haitians | 0.0 /100 | #280 | Tragic 14.9% |
| Immigrants | Barbados | 0.0 /100 | #281 | Tragic 14.9% |
| Comanche | 0.0 /100 | #282 | Tragic 15.0% |
| Immigrants | Haiti | 0.0 /100 | #283 | Tragic 15.0% |
| West Indians | 0.0 /100 | #284 | Tragic 15.0% |
| Vietnamese | 0.0 /100 | #285 | Tragic 15.0% |
| Immigrants | Latin America | 0.0 /100 | #286 | Tragic 15.0% |
Demographics Similar to Alaska Natives by Poverty
In terms of poverty, the demographic groups most similar to Alaska Natives are Marshallese (13.4%, a difference of 0.15%), German Russian (13.4%, a difference of 0.16%), Immigrants from Eritrea (13.4%, a difference of 0.38%), Immigrants from Nigeria (13.5%, a difference of 0.45%), and Immigrants from Africa (13.4%, a difference of 0.48%).
| Demographics | Rating | Rank | Poverty |
| Americans | 2.9 /100 | #220 | Tragic 13.4% |
| Alsatians | 2.6 /100 | #221 | Tragic 13.4% |
| Immigrants | Micronesia | 2.6 /100 | #222 | Tragic 13.4% |
| Immigrants | Africa | 2.5 /100 | #223 | Tragic 13.4% |
| Immigrants | Eritrea | 2.4 /100 | #224 | Tragic 13.4% |
| German Russians | 2.2 /100 | #225 | Tragic 13.4% |
| Marshallese | 2.2 /100 | #226 | Tragic 13.4% |
| Alaska Natives | 2.1 /100 | #227 | Tragic 13.5% |
| Immigrants | Nigeria | 1.7 /100 | #228 | Tragic 13.5% |
| Osage | 1.5 /100 | #229 | Tragic 13.6% |
| Alaskan Athabascans | 1.5 /100 | #230 | Tragic 13.6% |
| Nigerians | 1.4 /100 | #231 | Tragic 13.6% |
| Fijians | 0.8 /100 | #232 | Tragic 13.7% |
| Immigrants | Saudi Arabia | 0.8 /100 | #233 | Tragic 13.8% |
| Immigrants | Laos | 0.7 /100 | #234 | Tragic 13.8% |