Chickasaw vs Alaska Native Professional Degree
COMPARE
Chickasaw
Alaska Native
Professional Degree
Professional Degree Comparison
Chickasaw
Alaska Natives
3.4%
PROFESSIONAL DEGREE
0.1/ 100
METRIC RATING
305th/ 347
METRIC RANK
3.5%
PROFESSIONAL DEGREE
0.3/ 100
METRIC RATING
291st/ 347
METRIC RANK
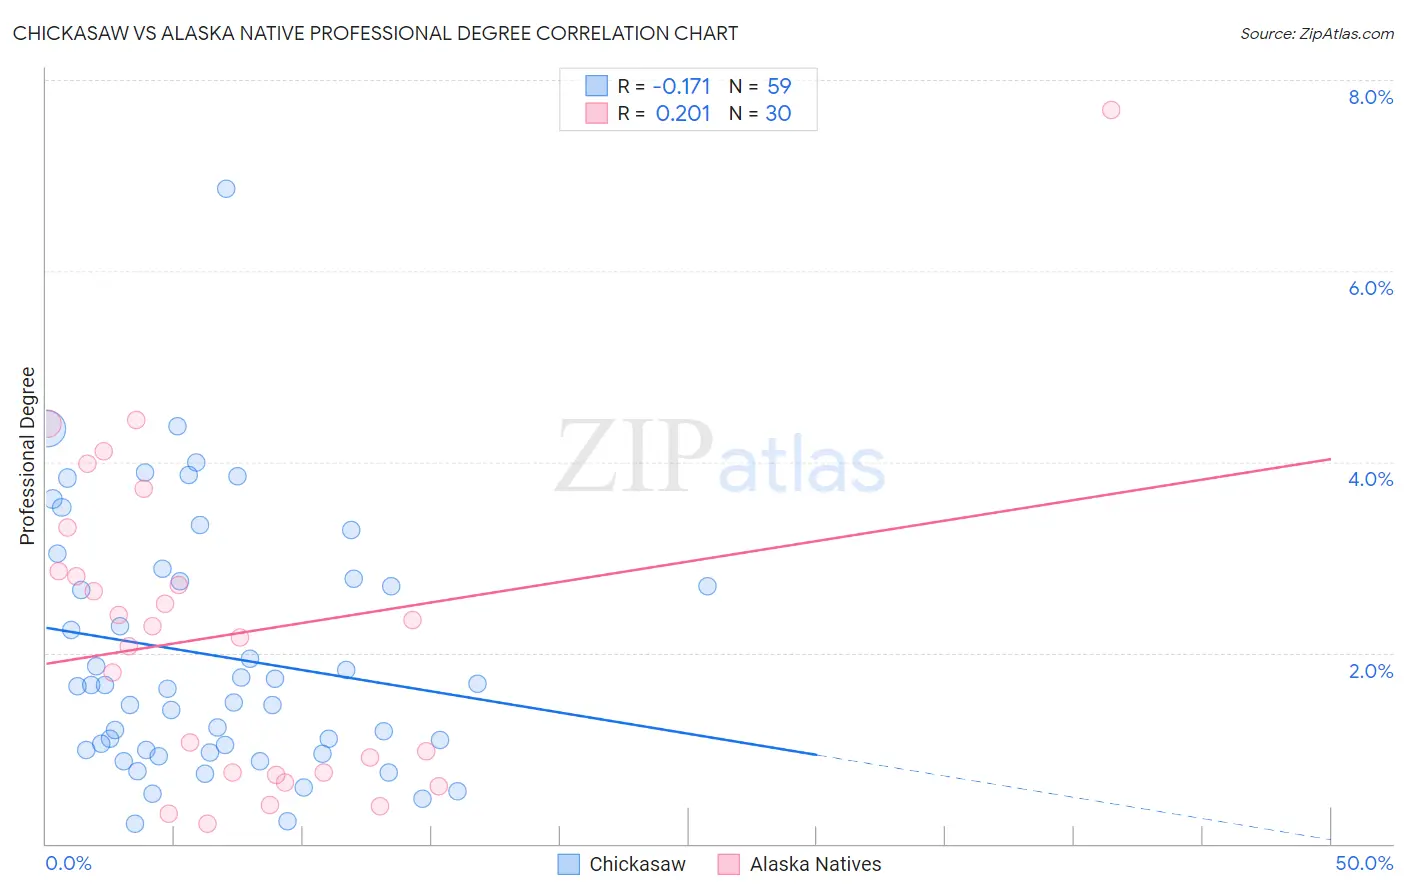
Chickasaw vs Alaska Native Professional Degree Correlation Chart
The statistical analysis conducted on geographies consisting of 147,338,770 people shows a poor negative correlation between the proportion of Chickasaw and percentage of population with at least professional degree education in the United States with a correlation coefficient (R) of -0.171 and weighted average of 3.4%. Similarly, the statistical analysis conducted on geographies consisting of 76,648,508 people shows a weak positive correlation between the proportion of Alaska Natives and percentage of population with at least professional degree education in the United States with a correlation coefficient (R) of 0.201 and weighted average of 3.5%, a difference of 3.0%.
Professional Degree Correlation Summary
| Measurement | Chickasaw | Alaska Native |
| Minimum | 0.21% | 0.21% |
| Maximum | 6.9% | 7.7% |
| Range | 6.6% | 7.5% |
| Mean | 2.0% | 2.2% |
| Median | 1.6% | 2.2% |
| Interquartile 25% (IQ1) | 0.98% | 0.74% |
| Interquartile 75% (IQ3) | 2.8% | 2.9% |
| Interquartile Range (IQR) | 1.8% | 2.1% |
| Standard Deviation (Sample) | 1.3% | 1.7% |
| Standard Deviation (Population) | 1.3% | 1.7% |
Demographics Similar to Chickasaw and Alaska Natives by Professional Degree
In terms of professional degree, the demographic groups most similar to Chickasaw are Cape Verdean (3.4%, a difference of 0.010%), Cajun (3.4%, a difference of 0.30%), Immigrants from Haiti (3.4%, a difference of 0.31%), Malaysian (3.4%, a difference of 0.97%), and Samoan (3.3%, a difference of 1.1%). Similarly, the demographic groups most similar to Alaska Natives are Immigrants from Belize (3.5%, a difference of 0.070%), Chippewa (3.5%, a difference of 0.17%), Guatemalan (3.5%, a difference of 0.18%), Immigrants from Honduras (3.5%, a difference of 0.30%), and Blackfeet (3.5%, a difference of 0.36%).
| Demographics | Rating | Rank | Professional Degree |
| Blackfeet | 0.3 /100 | #288 | Tragic 3.5% |
| Guatemalans | 0.3 /100 | #289 | Tragic 3.5% |
| Chippewa | 0.3 /100 | #290 | Tragic 3.5% |
| Alaska Natives | 0.3 /100 | #291 | Tragic 3.5% |
| Immigrants | Belize | 0.3 /100 | #292 | Tragic 3.5% |
| Immigrants | Honduras | 0.3 /100 | #293 | Tragic 3.5% |
| Paiute | 0.3 /100 | #294 | Tragic 3.4% |
| Immigrants | Guatemala | 0.2 /100 | #295 | Tragic 3.4% |
| Hawaiians | 0.2 /100 | #296 | Tragic 3.4% |
| Immigrants | Liberia | 0.2 /100 | #297 | Tragic 3.4% |
| Ottawa | 0.2 /100 | #298 | Tragic 3.4% |
| Immigrants | Yemen | 0.2 /100 | #299 | Tragic 3.4% |
| Blacks/African Americans | 0.2 /100 | #300 | Tragic 3.4% |
| Immigrants | Dominican Republic | 0.2 /100 | #301 | Tragic 3.4% |
| Malaysians | 0.2 /100 | #302 | Tragic 3.4% |
| Immigrants | Haiti | 0.2 /100 | #303 | Tragic 3.4% |
| Cajuns | 0.2 /100 | #304 | Tragic 3.4% |
| Chickasaw | 0.1 /100 | #305 | Tragic 3.4% |
| Cape Verdeans | 0.1 /100 | #306 | Tragic 3.4% |
| Samoans | 0.1 /100 | #307 | Tragic 3.3% |
| Shoshone | 0.1 /100 | #308 | Tragic 3.3% |