Immigrants from Honduras vs Alaska Native Poverty
COMPARE
Immigrants from Honduras
Alaska Native
Poverty
Poverty Comparison
Immigrants from Honduras
Alaska Natives
16.2%
POVERTY
0.0/ 100
METRIC RATING
320th/ 347
METRIC RANK
13.5%
POVERTY
2.1/ 100
METRIC RATING
227th/ 347
METRIC RANK
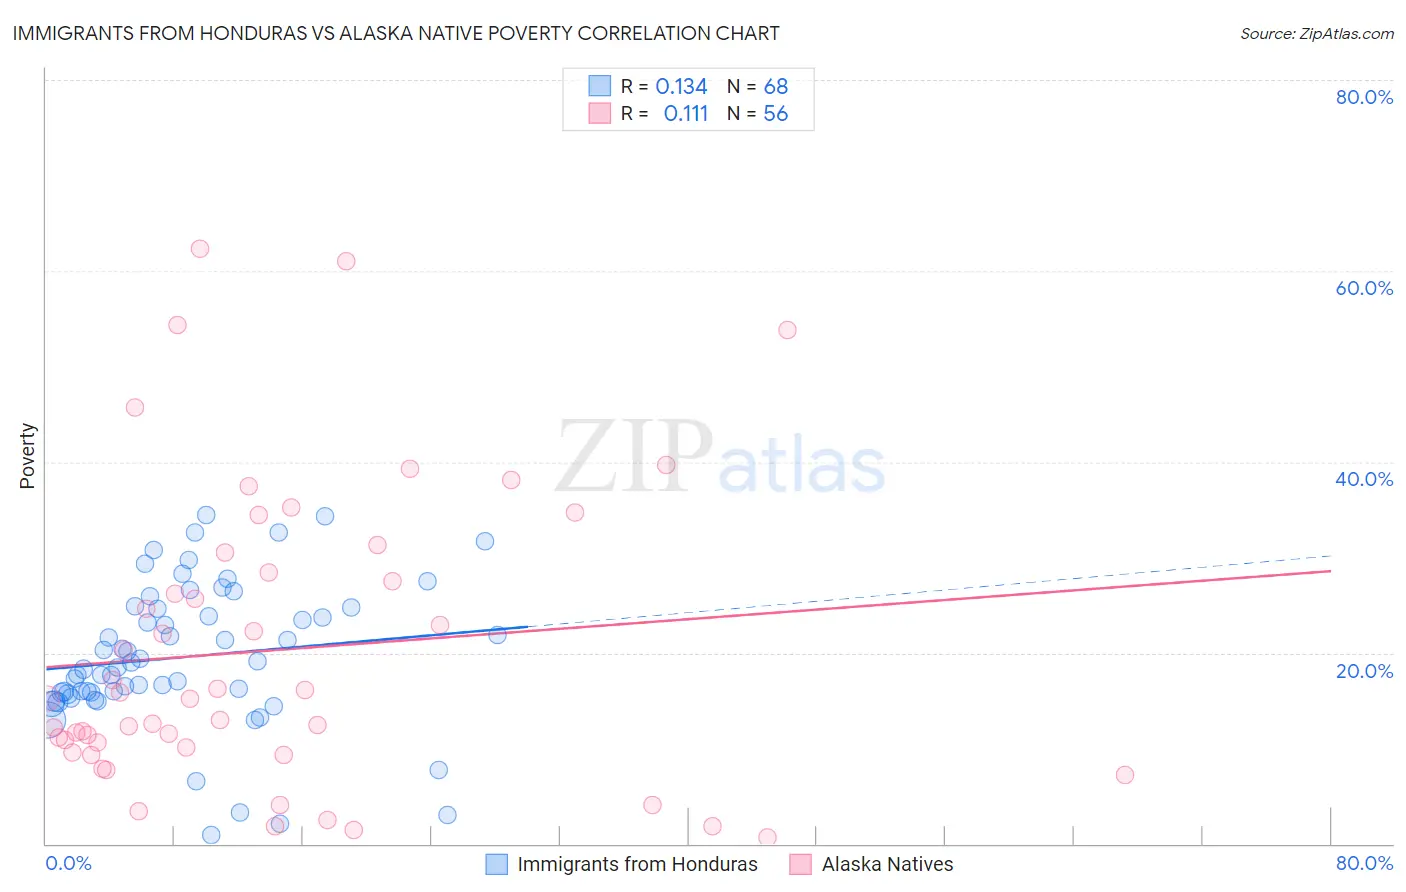
Immigrants from Honduras vs Alaska Native Poverty Correlation Chart
The statistical analysis conducted on geographies consisting of 322,477,641 people shows a poor positive correlation between the proportion of Immigrants from Honduras and poverty level in the United States with a correlation coefficient (R) of 0.134 and weighted average of 16.2%. Similarly, the statistical analysis conducted on geographies consisting of 76,760,249 people shows a poor positive correlation between the proportion of Alaska Natives and poverty level in the United States with a correlation coefficient (R) of 0.111 and weighted average of 13.5%, a difference of 20.0%.
Poverty Correlation Summary
| Measurement | Immigrants from Honduras | Alaska Native |
| Minimum | 0.89% | 0.63% |
| Maximum | 34.4% | 62.3% |
| Range | 33.5% | 61.6% |
| Mean | 19.6% | 20.3% |
| Median | 18.7% | 15.2% |
| Interquartile 25% (IQ1) | 15.7% | 9.8% |
| Interquartile 75% (IQ3) | 24.7% | 29.5% |
| Interquartile Range (IQR) | 9.0% | 19.7% |
| Standard Deviation (Sample) | 7.5% | 15.5% |
| Standard Deviation (Population) | 7.4% | 15.4% |
Similar Demographics by Poverty
Demographics Similar to Immigrants from Honduras by Poverty
In terms of poverty, the demographic groups most similar to Immigrants from Honduras are Immigrants from Congo (16.1%, a difference of 0.23%), Immigrants from Dominica (16.1%, a difference of 0.43%), U.S. Virgin Islander (16.1%, a difference of 0.72%), Arapaho (16.3%, a difference of 0.74%), and Menominee (16.4%, a difference of 1.7%).
| Demographics | Rating | Rank | Poverty |
| Immigrants | Grenada | 0.0 /100 | #313 | Tragic 15.8% |
| Immigrants | Somalia | 0.0 /100 | #314 | Tragic 15.8% |
| British West Indians | 0.0 /100 | #315 | Tragic 15.9% |
| Hondurans | 0.0 /100 | #316 | Tragic 15.9% |
| U.S. Virgin Islanders | 0.0 /100 | #317 | Tragic 16.1% |
| Immigrants | Dominica | 0.0 /100 | #318 | Tragic 16.1% |
| Immigrants | Congo | 0.0 /100 | #319 | Tragic 16.1% |
| Immigrants | Honduras | 0.0 /100 | #320 | Tragic 16.2% |
| Arapaho | 0.0 /100 | #321 | Tragic 16.3% |
| Menominee | 0.0 /100 | #322 | Tragic 16.4% |
| Colville | 0.0 /100 | #323 | Tragic 16.6% |
| Yakama | 0.0 /100 | #324 | Tragic 16.7% |
| Central American Indians | 0.0 /100 | #325 | Tragic 16.7% |
| Paiute | 0.0 /100 | #326 | Tragic 16.7% |
| Kiowa | 0.0 /100 | #327 | Tragic 16.8% |
Demographics Similar to Alaska Natives by Poverty
In terms of poverty, the demographic groups most similar to Alaska Natives are Marshallese (13.4%, a difference of 0.15%), German Russian (13.4%, a difference of 0.16%), Immigrants from Eritrea (13.4%, a difference of 0.38%), Immigrants from Nigeria (13.5%, a difference of 0.45%), and Immigrants from Africa (13.4%, a difference of 0.48%).
| Demographics | Rating | Rank | Poverty |
| Americans | 2.9 /100 | #220 | Tragic 13.4% |
| Alsatians | 2.6 /100 | #221 | Tragic 13.4% |
| Immigrants | Micronesia | 2.6 /100 | #222 | Tragic 13.4% |
| Immigrants | Africa | 2.5 /100 | #223 | Tragic 13.4% |
| Immigrants | Eritrea | 2.4 /100 | #224 | Tragic 13.4% |
| German Russians | 2.2 /100 | #225 | Tragic 13.4% |
| Marshallese | 2.2 /100 | #226 | Tragic 13.4% |
| Alaska Natives | 2.1 /100 | #227 | Tragic 13.5% |
| Immigrants | Nigeria | 1.7 /100 | #228 | Tragic 13.5% |
| Osage | 1.5 /100 | #229 | Tragic 13.6% |
| Alaskan Athabascans | 1.5 /100 | #230 | Tragic 13.6% |
| Nigerians | 1.4 /100 | #231 | Tragic 13.6% |
| Fijians | 0.8 /100 | #232 | Tragic 13.7% |
| Immigrants | Saudi Arabia | 0.8 /100 | #233 | Tragic 13.8% |
| Immigrants | Laos | 0.7 /100 | #234 | Tragic 13.8% |