Cheyenne vs Immigrants from Sudan Master's Degree
COMPARE
Cheyenne
Immigrants from Sudan
Master's Degree
Master's Degree Comparison
Cheyenne
Immigrants from Sudan
11.2%
MASTER'S DEGREE
0.0/ 100
METRIC RATING
307th/ 347
METRIC RANK
16.0%
MASTER'S DEGREE
90.2/ 100
METRIC RATING
133rd/ 347
METRIC RANK
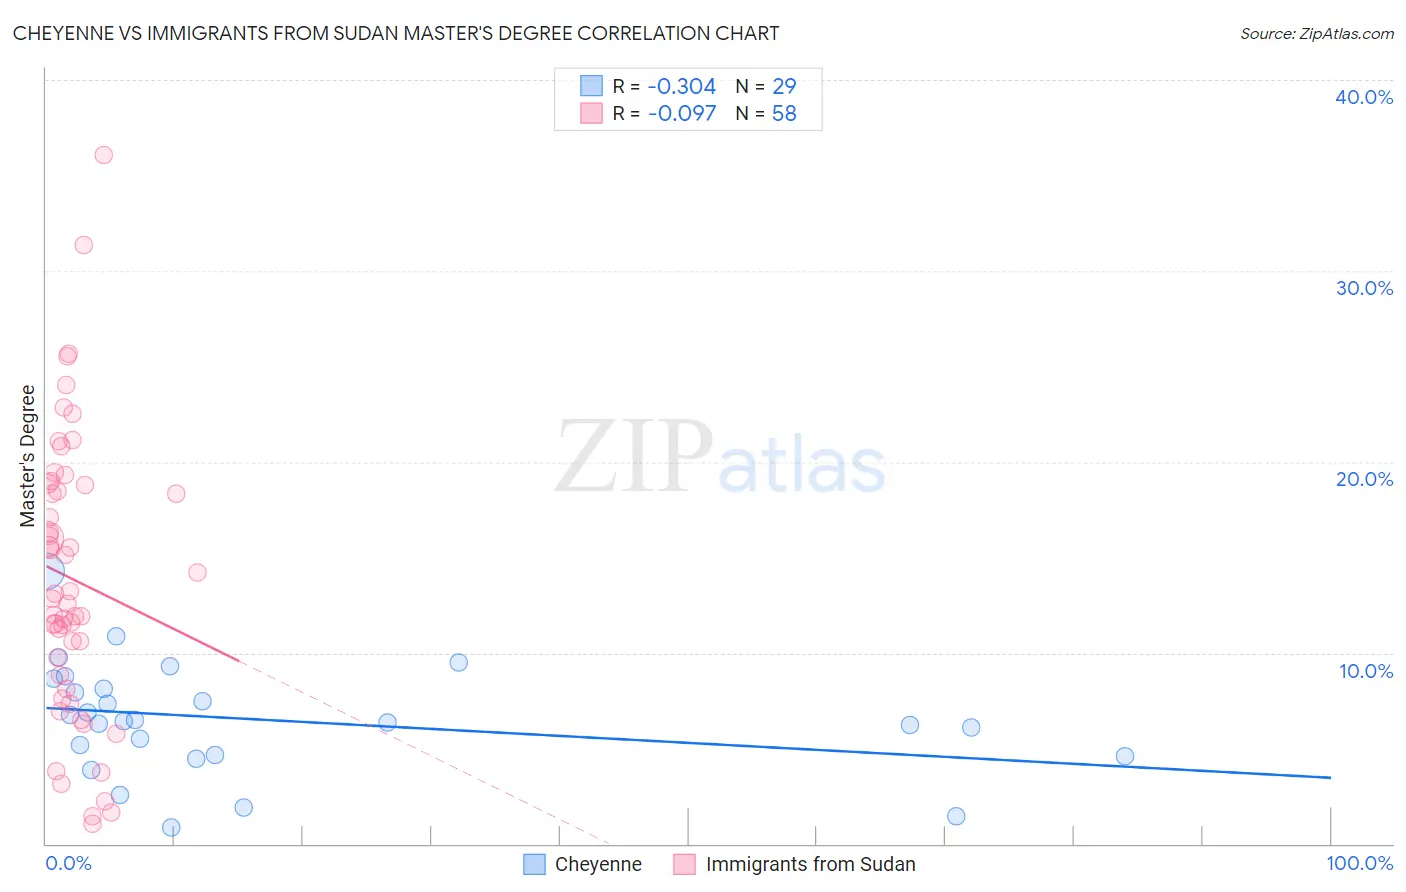
Cheyenne vs Immigrants from Sudan Master's Degree Correlation Chart
The statistical analysis conducted on geographies consisting of 80,705,312 people shows a mild negative correlation between the proportion of Cheyenne and percentage of population with at least master's degree education in the United States with a correlation coefficient (R) of -0.304 and weighted average of 11.2%. Similarly, the statistical analysis conducted on geographies consisting of 118,960,679 people shows a slight negative correlation between the proportion of Immigrants from Sudan and percentage of population with at least master's degree education in the United States with a correlation coefficient (R) of -0.097 and weighted average of 16.0%, a difference of 42.3%.
Master's Degree Correlation Summary
| Measurement | Cheyenne | Immigrants from Sudan |
| Minimum | 0.84% | 1.0% |
| Maximum | 14.3% | 36.1% |
| Range | 13.5% | 35.0% |
| Mean | 6.5% | 13.9% |
| Median | 6.4% | 13.0% |
| Interquartile 25% (IQ1) | 4.6% | 8.8% |
| Interquartile 75% (IQ3) | 8.4% | 18.8% |
| Interquartile Range (IQR) | 3.8% | 10.0% |
| Standard Deviation (Sample) | 2.9% | 7.4% |
| Standard Deviation (Population) | 2.9% | 7.3% |
Similar Demographics by Master's Degree
Demographics Similar to Cheyenne by Master's Degree
In terms of master's degree, the demographic groups most similar to Cheyenne are Mexican American Indian (11.2%, a difference of 0.15%), Immigrants from Latin America (11.3%, a difference of 0.34%), Puerto Rican (11.2%, a difference of 0.55%), Puget Sound Salish (11.1%, a difference of 0.84%), and Immigrants from Cabo Verde (11.3%, a difference of 0.99%).
| Demographics | Rating | Rank | Master's Degree |
| Chippewa | 0.1 /100 | #300 | Tragic 11.4% |
| Tsimshian | 0.1 /100 | #301 | Tragic 11.4% |
| Cherokee | 0.1 /100 | #302 | Tragic 11.4% |
| Immigrants | Laos | 0.1 /100 | #303 | Tragic 11.4% |
| Immigrants | Cabo Verde | 0.1 /100 | #304 | Tragic 11.3% |
| Immigrants | Latin America | 0.0 /100 | #305 | Tragic 11.3% |
| Mexican American Indians | 0.0 /100 | #306 | Tragic 11.2% |
| Cheyenne | 0.0 /100 | #307 | Tragic 11.2% |
| Puerto Ricans | 0.0 /100 | #308 | Tragic 11.2% |
| Puget Sound Salish | 0.0 /100 | #309 | Tragic 11.1% |
| Shoshone | 0.0 /100 | #310 | Tragic 11.1% |
| Seminole | 0.0 /100 | #311 | Tragic 11.0% |
| Choctaw | 0.0 /100 | #312 | Tragic 11.0% |
| Yaqui | 0.0 /100 | #313 | Tragic 11.0% |
| Cajuns | 0.0 /100 | #314 | Tragic 11.0% |
Demographics Similar to Immigrants from Sudan by Master's Degree
In terms of master's degree, the demographic groups most similar to Immigrants from Sudan are Serbian (16.1%, a difference of 0.54%), Venezuelan (15.9%, a difference of 0.56%), South American Indian (15.9%, a difference of 0.56%), Taiwanese (16.1%, a difference of 0.63%), and Immigrants from Jordan (16.1%, a difference of 0.95%).
| Demographics | Rating | Rank | Master's Degree |
| Immigrants | Eastern Africa | 95.2 /100 | #126 | Exceptional 16.3% |
| Palestinians | 94.8 /100 | #127 | Exceptional 16.3% |
| Immigrants | Sierra Leone | 94.7 /100 | #128 | Exceptional 16.3% |
| Immigrants | Syria | 93.3 /100 | #129 | Exceptional 16.2% |
| Immigrants | Jordan | 92.7 /100 | #130 | Exceptional 16.1% |
| Taiwanese | 91.9 /100 | #131 | Exceptional 16.1% |
| Serbians | 91.7 /100 | #132 | Exceptional 16.1% |
| Immigrants | Sudan | 90.2 /100 | #133 | Exceptional 16.0% |
| Venezuelans | 88.4 /100 | #134 | Excellent 15.9% |
| South American Indians | 88.4 /100 | #135 | Excellent 15.9% |
| Assyrians/Chaldeans/Syriacs | 86.8 /100 | #136 | Excellent 15.8% |
| Europeans | 86.4 /100 | #137 | Excellent 15.8% |
| Pakistanis | 86.1 /100 | #138 | Excellent 15.8% |
| Immigrants | Germany | 85.9 /100 | #139 | Excellent 15.8% |
| Vietnamese | 85.5 /100 | #140 | Excellent 15.8% |