Cheyenne vs Immigrants from Sudan Female Poverty Among 18-24 Year Olds
COMPARE
Cheyenne
Immigrants from Sudan
Female Poverty Among 18-24 Year Olds
Female Poverty Among 18-24 Year Olds Comparison
Cheyenne
Immigrants from Sudan
28.1%
FEMALE POVERTY AMONG 18-24 YEAR OLDS
0.0/ 100
METRIC RATING
337th/ 347
METRIC RANK
23.5%
FEMALE POVERTY AMONG 18-24 YEAR OLDS
0.0/ 100
METRIC RATING
308th/ 347
METRIC RANK
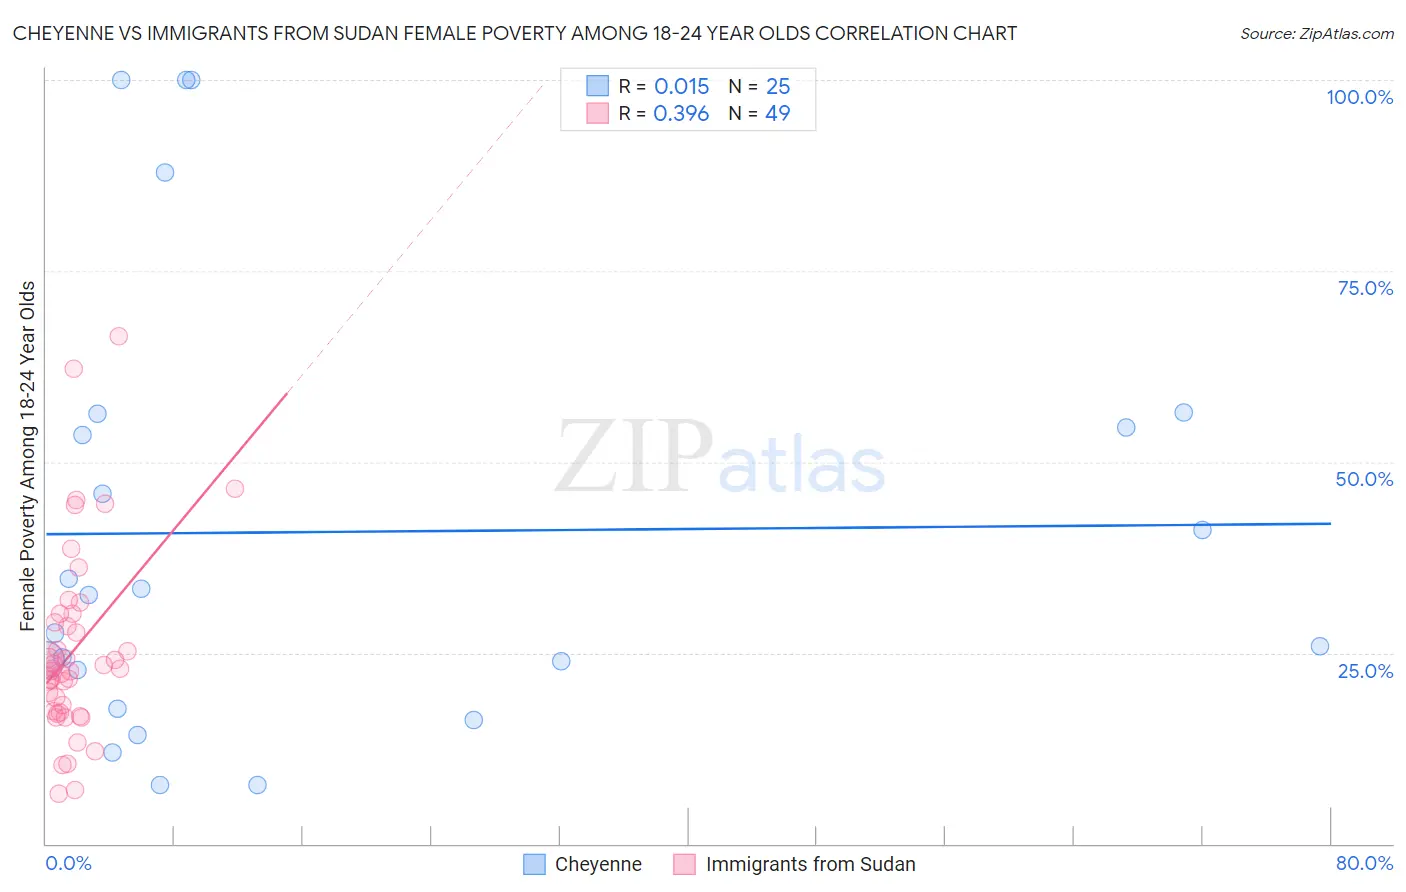
Cheyenne vs Immigrants from Sudan Female Poverty Among 18-24 Year Olds Correlation Chart
The statistical analysis conducted on geographies consisting of 80,212,982 people shows no correlation between the proportion of Cheyenne and poverty level among females between the ages 18 and 24 in the United States with a correlation coefficient (R) of 0.015 and weighted average of 28.1%. Similarly, the statistical analysis conducted on geographies consisting of 118,546,695 people shows a mild positive correlation between the proportion of Immigrants from Sudan and poverty level among females between the ages 18 and 24 in the United States with a correlation coefficient (R) of 0.396 and weighted average of 23.5%, a difference of 19.7%.
Female Poverty Among 18-24 Year Olds Correlation Summary
| Measurement | Cheyenne | Immigrants from Sudan |
| Minimum | 7.7% | 6.5% |
| Maximum | 100.0% | 66.5% |
| Range | 92.3% | 59.9% |
| Mean | 40.8% | 25.4% |
| Median | 32.6% | 22.9% |
| Interquartile 25% (IQ1) | 20.2% | 17.3% |
| Interquartile 75% (IQ3) | 55.5% | 29.6% |
| Interquartile Range (IQR) | 35.2% | 12.3% |
| Standard Deviation (Sample) | 29.0% | 12.3% |
| Standard Deviation (Population) | 28.4% | 12.2% |
Similar Demographics by Female Poverty Among 18-24 Year Olds
Demographics Similar to Cheyenne by Female Poverty Among 18-24 Year Olds
In terms of female poverty among 18-24 year olds, the demographic groups most similar to Cheyenne are Hopi (28.2%, a difference of 0.21%), Pima (28.4%, a difference of 0.94%), Sioux (28.6%, a difference of 1.5%), Immigrants from Yemen (27.5%, a difference of 2.2%), and Colville (29.0%, a difference of 3.1%).
| Demographics | Rating | Rank | Female Poverty Among 18-24 Year Olds |
| Immigrants | Somalia | 0.0 /100 | #330 | Tragic 25.7% |
| Chippewa | 0.0 /100 | #331 | Tragic 25.9% |
| Houma | 0.0 /100 | #332 | Tragic 26.2% |
| Apache | 0.0 /100 | #333 | Tragic 26.3% |
| Pueblo | 0.0 /100 | #334 | Tragic 26.9% |
| Yup'ik | 0.0 /100 | #335 | Tragic 27.0% |
| Immigrants | Yemen | 0.0 /100 | #336 | Tragic 27.5% |
| Cheyenne | 0.0 /100 | #337 | Tragic 28.1% |
| Hopi | 0.0 /100 | #338 | Tragic 28.2% |
| Pima | 0.0 /100 | #339 | Tragic 28.4% |
| Sioux | 0.0 /100 | #340 | Tragic 28.6% |
| Colville | 0.0 /100 | #341 | Tragic 29.0% |
| Kiowa | 0.0 /100 | #342 | Tragic 29.2% |
| Puerto Ricans | 0.0 /100 | #343 | Tragic 29.8% |
| Navajo | 0.0 /100 | #344 | Tragic 30.3% |
Demographics Similar to Immigrants from Sudan by Female Poverty Among 18-24 Year Olds
In terms of female poverty among 18-24 year olds, the demographic groups most similar to Immigrants from Sudan are Cree (23.4%, a difference of 0.35%), Blackfeet (23.6%, a difference of 0.45%), Comanche (23.6%, a difference of 0.50%), Potawatomi (23.7%, a difference of 0.79%), and Paiute (23.3%, a difference of 0.94%).
| Demographics | Rating | Rank | Female Poverty Among 18-24 Year Olds |
| Seminole | 0.0 /100 | #301 | Tragic 22.9% |
| Iroquois | 0.0 /100 | #302 | Tragic 22.9% |
| Senegalese | 0.0 /100 | #303 | Tragic 23.0% |
| Sudanese | 0.0 /100 | #304 | Tragic 23.0% |
| Immigrants | Kuwait | 0.0 /100 | #305 | Tragic 23.0% |
| Paiute | 0.0 /100 | #306 | Tragic 23.3% |
| Cree | 0.0 /100 | #307 | Tragic 23.4% |
| Immigrants | Sudan | 0.0 /100 | #308 | Tragic 23.5% |
| Blackfeet | 0.0 /100 | #309 | Tragic 23.6% |
| Comanche | 0.0 /100 | #310 | Tragic 23.6% |
| Potawatomi | 0.0 /100 | #311 | Tragic 23.7% |
| Yuman | 0.0 /100 | #312 | Tragic 24.0% |
| Creek | 0.0 /100 | #313 | Tragic 24.2% |
| Choctaw | 0.0 /100 | #314 | Tragic 24.3% |
| Blacks/African Americans | 0.0 /100 | #315 | Tragic 24.3% |