Cherokee vs Hungarian Female Poverty
COMPARE
Cherokee
Hungarian
Female Poverty
Female Poverty Comparison
Cherokee
Hungarians
15.6%
FEMALE POVERTY
0.1/ 100
METRIC RATING
263rd/ 347
METRIC RANK
13.2%
FEMALE POVERTY
70.1/ 100
METRIC RATING
155th/ 347
METRIC RANK
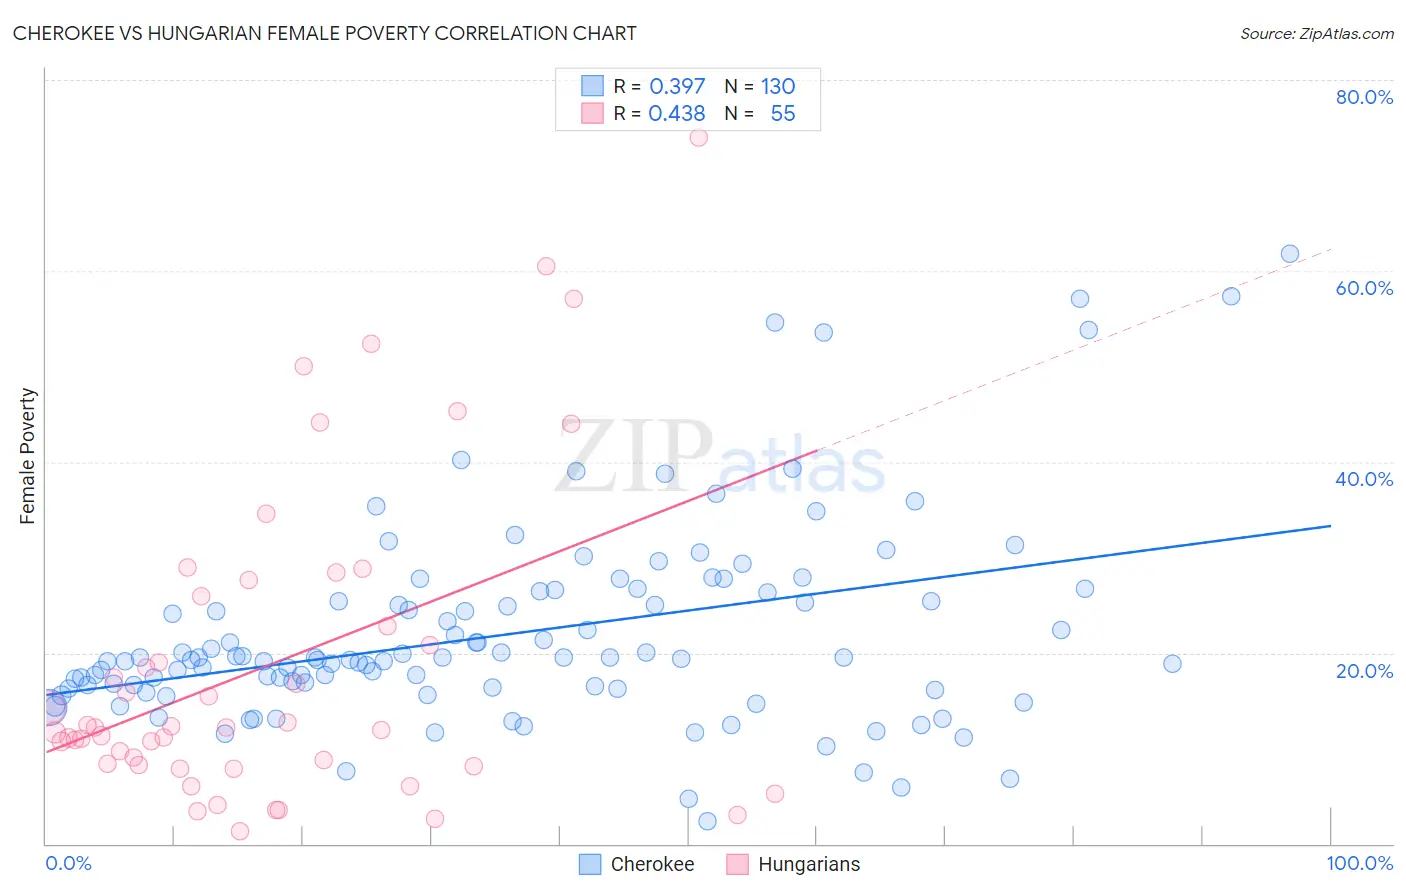
Cherokee vs Hungarian Female Poverty Correlation Chart
The statistical analysis conducted on geographies consisting of 493,220,722 people shows a mild positive correlation between the proportion of Cherokee and poverty level among females in the United States with a correlation coefficient (R) of 0.397 and weighted average of 15.6%. Similarly, the statistical analysis conducted on geographies consisting of 485,692,155 people shows a moderate positive correlation between the proportion of Hungarians and poverty level among females in the United States with a correlation coefficient (R) of 0.438 and weighted average of 13.2%, a difference of 18.6%.
Female Poverty Correlation Summary
| Measurement | Cherokee | Hungarian |
| Minimum | 2.3% | 1.3% |
| Maximum | 61.8% | 73.9% |
| Range | 59.5% | 72.6% |
| Mean | 21.9% | 18.8% |
| Median | 19.3% | 12.1% |
| Interquartile 25% (IQ1) | 16.3% | 8.2% |
| Interquartile 75% (IQ3) | 25.5% | 26.0% |
| Interquartile Range (IQR) | 9.2% | 17.7% |
| Standard Deviation (Sample) | 10.5% | 16.6% |
| Standard Deviation (Population) | 10.5% | 16.5% |
Similar Demographics by Female Poverty
Demographics Similar to Cherokee by Female Poverty
In terms of female poverty, the demographic groups most similar to Cherokee are Guyanese (15.6%, a difference of 0.010%), Mexican American Indian (15.6%, a difference of 0.010%), Immigrants from Guyana (15.6%, a difference of 0.11%), Immigrants from Ecuador (15.6%, a difference of 0.13%), and Cape Verdean (15.6%, a difference of 0.19%).
| Demographics | Rating | Rank | Female Poverty |
| Jamaicans | 0.2 /100 | #256 | Tragic 15.5% |
| Immigrants | Jamaica | 0.1 /100 | #257 | Tragic 15.6% |
| Shoshone | 0.1 /100 | #258 | Tragic 15.6% |
| Cape Verdeans | 0.1 /100 | #259 | Tragic 15.6% |
| Immigrants | Guyana | 0.1 /100 | #260 | Tragic 15.6% |
| Guyanese | 0.1 /100 | #261 | Tragic 15.6% |
| Mexican American Indians | 0.1 /100 | #262 | Tragic 15.6% |
| Cherokee | 0.1 /100 | #263 | Tragic 15.6% |
| Immigrants | Ecuador | 0.1 /100 | #264 | Tragic 15.6% |
| Immigrants | Liberia | 0.1 /100 | #265 | Tragic 15.7% |
| Immigrants | El Salvador | 0.1 /100 | #266 | Tragic 15.7% |
| Sub-Saharan Africans | 0.1 /100 | #267 | Tragic 15.8% |
| Immigrants | Nicaragua | 0.1 /100 | #268 | Tragic 15.8% |
| Iroquois | 0.1 /100 | #269 | Tragic 15.8% |
| Chickasaw | 0.1 /100 | #270 | Tragic 15.9% |
Demographics Similar to Hungarians by Female Poverty
In terms of female poverty, the demographic groups most similar to Hungarians are Armenian (13.2%, a difference of 0.040%), Immigrants from Bosnia and Herzegovina (13.2%, a difference of 0.050%), Immigrants from Fiji (13.2%, a difference of 0.10%), Immigrants from Northern Africa (13.2%, a difference of 0.15%), and Pennsylvania German (13.2%, a difference of 0.32%).
| Demographics | Rating | Rank | Female Poverty |
| Yugoslavians | 76.9 /100 | #148 | Good 13.1% |
| Taiwanese | 75.7 /100 | #149 | Good 13.1% |
| Tsimshian | 75.5 /100 | #150 | Good 13.1% |
| Immigrants | Germany | 74.9 /100 | #151 | Good 13.1% |
| Samoans | 73.6 /100 | #152 | Good 13.1% |
| Immigrants | Fiji | 71.0 /100 | #153 | Good 13.2% |
| Armenians | 70.4 /100 | #154 | Good 13.2% |
| Hungarians | 70.1 /100 | #155 | Good 13.2% |
| Immigrants | Bosnia and Herzegovina | 69.7 /100 | #156 | Good 13.2% |
| Immigrants | Northern Africa | 68.8 /100 | #157 | Good 13.2% |
| Pennsylvania Germans | 67.3 /100 | #158 | Good 13.2% |
| Costa Ricans | 63.6 /100 | #159 | Good 13.3% |
| Immigrants | Nepal | 62.7 /100 | #160 | Good 13.3% |
| Immigrants | Ethiopia | 62.5 /100 | #161 | Good 13.3% |
| Guamanians/Chamorros | 62.4 /100 | #162 | Good 13.3% |