Cherokee vs Hungarian Single Father Households
COMPARE
Cherokee
Hungarian
Single Father Households
Single Father Households Comparison
Cherokee
Hungarians
2.6%
SINGLE FATHER HOUSEHOLDS
0.1/ 100
METRIC RATING
278th/ 347
METRIC RANK
2.2%
SINGLE FATHER HOUSEHOLDS
97.9/ 100
METRIC RATING
117th/ 347
METRIC RANK
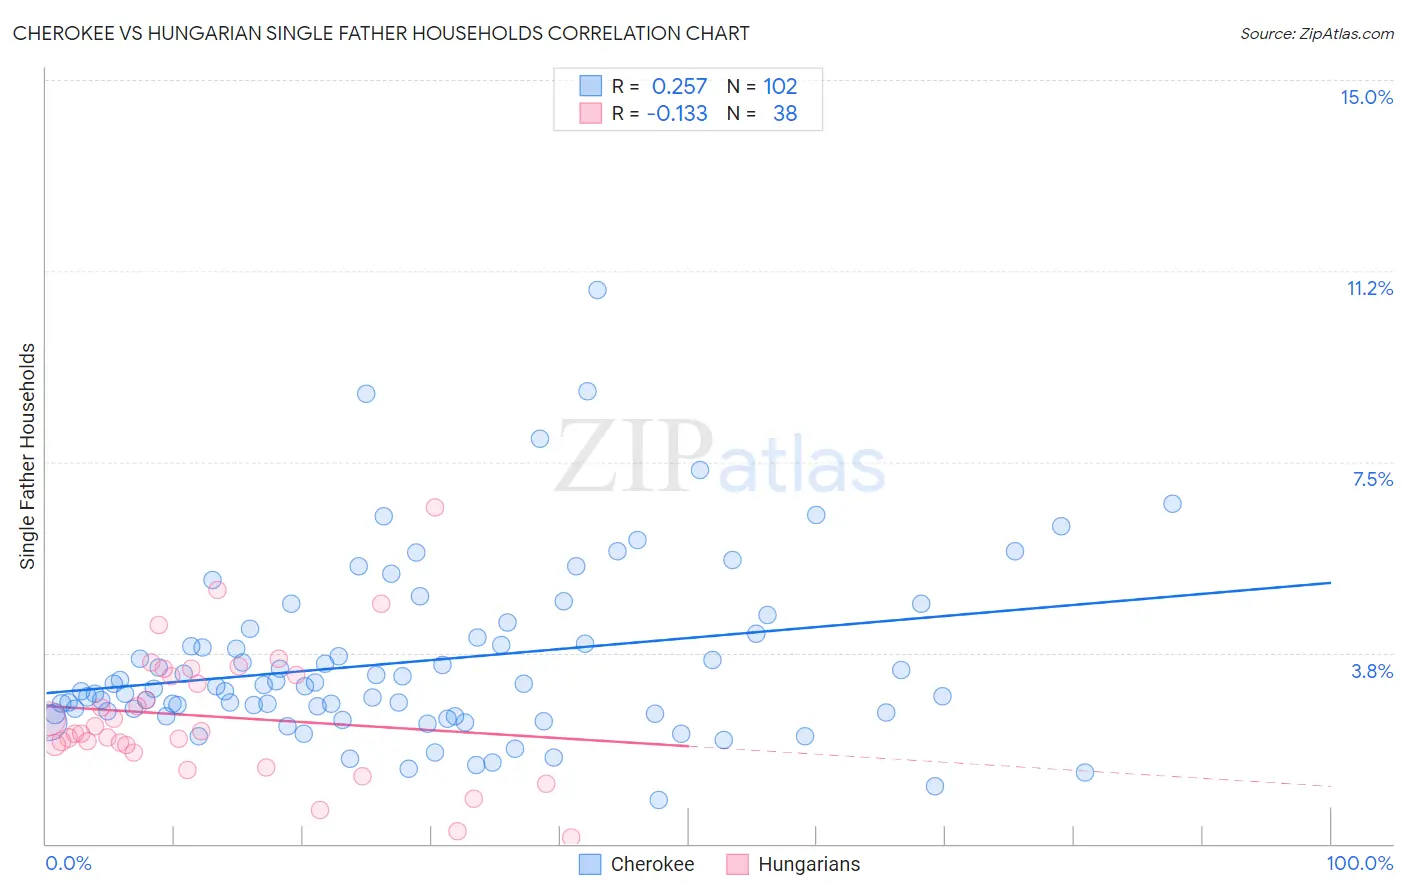
Cherokee vs Hungarian Single Father Households Correlation Chart
The statistical analysis conducted on geographies consisting of 486,508,076 people shows a weak positive correlation between the proportion of Cherokee and percentage of single father households in the United States with a correlation coefficient (R) of 0.257 and weighted average of 2.6%. Similarly, the statistical analysis conducted on geographies consisting of 478,655,062 people shows a poor negative correlation between the proportion of Hungarians and percentage of single father households in the United States with a correlation coefficient (R) of -0.133 and weighted average of 2.2%, a difference of 20.8%.
Single Father Households Correlation Summary
| Measurement | Cherokee | Hungarian |
| Minimum | 0.86% | 0.13% |
| Maximum | 10.9% | 6.6% |
| Range | 10.0% | 6.5% |
| Mean | 3.6% | 2.5% |
| Median | 3.1% | 2.2% |
| Interquartile 25% (IQ1) | 2.6% | 1.9% |
| Interquartile 75% (IQ3) | 4.1% | 3.3% |
| Interquartile Range (IQR) | 1.6% | 1.4% |
| Standard Deviation (Sample) | 1.7% | 1.3% |
| Standard Deviation (Population) | 1.7% | 1.3% |
Similar Demographics by Single Father Households
Demographics Similar to Cherokee by Single Father Households
In terms of single father households, the demographic groups most similar to Cherokee are Samoan (2.6%, a difference of 0.040%), Shoshone (2.6%, a difference of 0.050%), Immigrants from Haiti (2.6%, a difference of 0.080%), Immigrants from Dominican Republic (2.6%, a difference of 0.29%), and Immigrants from Portugal (2.6%, a difference of 0.59%).
| Demographics | Rating | Rank | Single Father Households |
| Creek | 0.2 /100 | #271 | Tragic 2.6% |
| Belizeans | 0.2 /100 | #272 | Tragic 2.6% |
| Iroquois | 0.2 /100 | #273 | Tragic 2.6% |
| Puerto Ricans | 0.2 /100 | #274 | Tragic 2.6% |
| Immigrants | Dominican Republic | 0.2 /100 | #275 | Tragic 2.6% |
| Immigrants | Haiti | 0.1 /100 | #276 | Tragic 2.6% |
| Shoshone | 0.1 /100 | #277 | Tragic 2.6% |
| Cherokee | 0.1 /100 | #278 | Tragic 2.6% |
| Samoans | 0.1 /100 | #279 | Tragic 2.6% |
| Immigrants | Portugal | 0.1 /100 | #280 | Tragic 2.6% |
| Nicaraguans | 0.1 /100 | #281 | Tragic 2.6% |
| Dutch West Indians | 0.1 /100 | #282 | Tragic 2.6% |
| Immigrants | Nicaragua | 0.1 /100 | #283 | Tragic 2.7% |
| Hawaiians | 0.1 /100 | #284 | Tragic 2.7% |
| Ottawa | 0.1 /100 | #285 | Tragic 2.7% |
Demographics Similar to Hungarians by Single Father Households
In terms of single father households, the demographic groups most similar to Hungarians are Immigrants from Morocco (2.2%, a difference of 0.10%), Trinidadian and Tobagonian (2.2%, a difference of 0.16%), Immigrants from Argentina (2.2%, a difference of 0.19%), Australian (2.2%, a difference of 0.19%), and Immigrants from Brazil (2.2%, a difference of 0.19%).
| Demographics | Rating | Rank | Single Father Households |
| Italians | 98.3 /100 | #110 | Exceptional 2.2% |
| Immigrants | Canada | 98.3 /100 | #111 | Exceptional 2.2% |
| Immigrants | Trinidad and Tobago | 98.2 /100 | #112 | Exceptional 2.2% |
| Iraqis | 98.2 /100 | #113 | Exceptional 2.2% |
| Immigrants | North America | 98.2 /100 | #114 | Exceptional 2.2% |
| Immigrants | Barbados | 98.2 /100 | #115 | Exceptional 2.2% |
| Immigrants | Argentina | 98.1 /100 | #116 | Exceptional 2.2% |
| Hungarians | 97.9 /100 | #117 | Exceptional 2.2% |
| Immigrants | Morocco | 97.8 /100 | #118 | Exceptional 2.2% |
| Trinidadians and Tobagonians | 97.8 /100 | #119 | Exceptional 2.2% |
| Australians | 97.7 /100 | #120 | Exceptional 2.2% |
| Immigrants | Brazil | 97.7 /100 | #121 | Exceptional 2.2% |
| Immigrants | Iraq | 97.6 /100 | #122 | Exceptional 2.2% |
| Immigrants | Yemen | 97.5 /100 | #123 | Exceptional 2.2% |
| British West Indians | 97.4 /100 | #124 | Exceptional 2.2% |