Cherokee vs Immigrants from Poland Female Poverty
COMPARE
Cherokee
Immigrants from Poland
Female Poverty
Female Poverty Comparison
Cherokee
Immigrants from Poland
15.6%
FEMALE POVERTY
0.1/ 100
METRIC RATING
263rd/ 347
METRIC RANK
11.8%
FEMALE POVERTY
99.3/ 100
METRIC RATING
39th/ 347
METRIC RANK
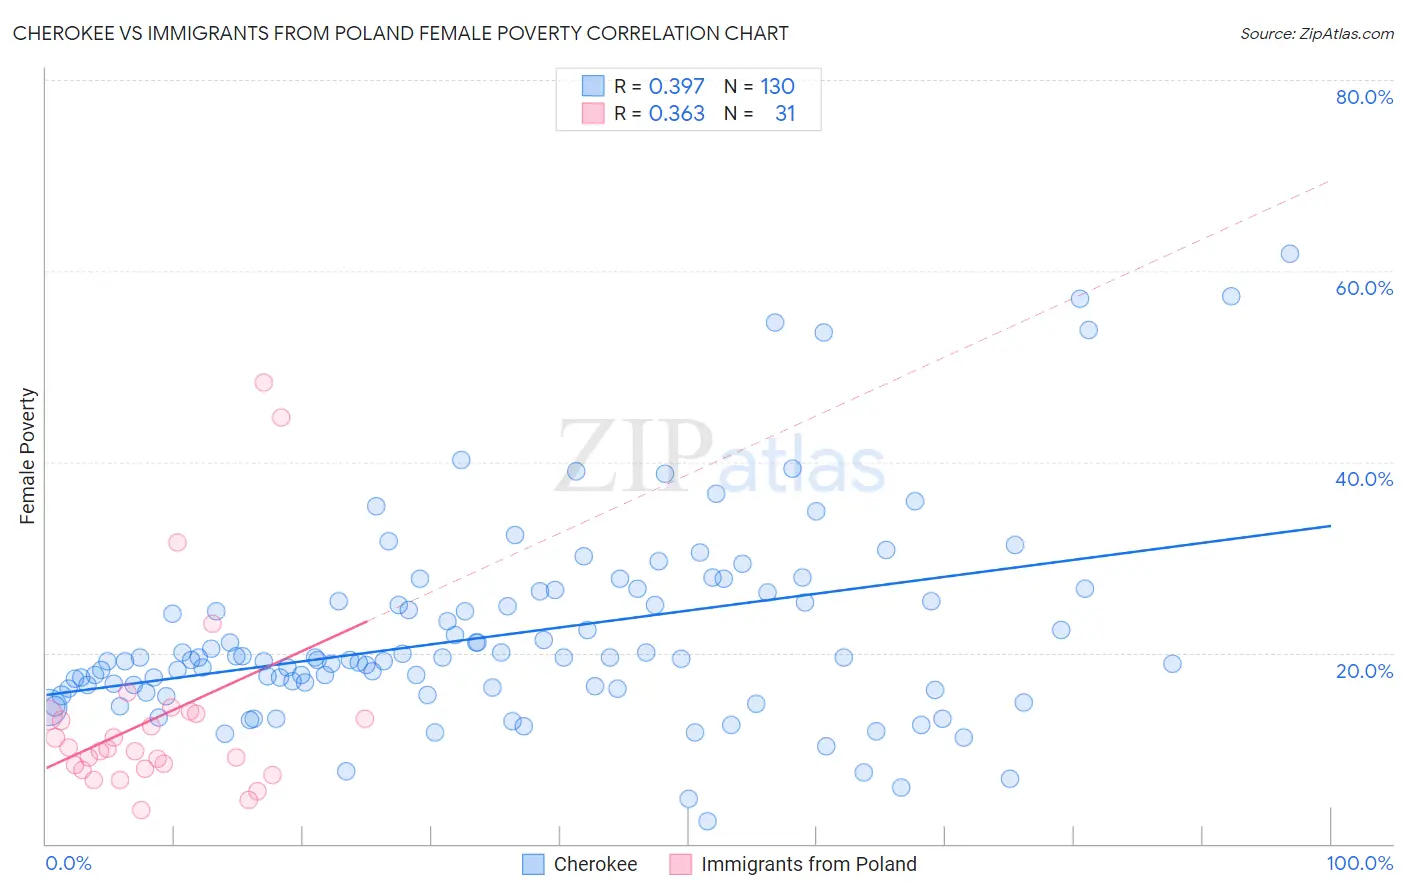
Cherokee vs Immigrants from Poland Female Poverty Correlation Chart
The statistical analysis conducted on geographies consisting of 493,220,722 people shows a mild positive correlation between the proportion of Cherokee and poverty level among females in the United States with a correlation coefficient (R) of 0.397 and weighted average of 15.6%. Similarly, the statistical analysis conducted on geographies consisting of 304,710,065 people shows a mild positive correlation between the proportion of Immigrants from Poland and poverty level among females in the United States with a correlation coefficient (R) of 0.363 and weighted average of 11.8%, a difference of 31.8%.
Female Poverty Correlation Summary
| Measurement | Cherokee | Immigrants from Poland |
| Minimum | 2.3% | 3.6% |
| Maximum | 61.8% | 48.3% |
| Range | 59.5% | 44.7% |
| Mean | 21.9% | 13.3% |
| Median | 19.3% | 10.0% |
| Interquartile 25% (IQ1) | 16.3% | 7.9% |
| Interquartile 75% (IQ3) | 25.5% | 13.6% |
| Interquartile Range (IQR) | 9.2% | 5.7% |
| Standard Deviation (Sample) | 10.5% | 10.4% |
| Standard Deviation (Population) | 10.5% | 10.2% |
Similar Demographics by Female Poverty
Demographics Similar to Cherokee by Female Poverty
In terms of female poverty, the demographic groups most similar to Cherokee are Guyanese (15.6%, a difference of 0.010%), Mexican American Indian (15.6%, a difference of 0.010%), Immigrants from Guyana (15.6%, a difference of 0.11%), Immigrants from Ecuador (15.6%, a difference of 0.13%), and Cape Verdean (15.6%, a difference of 0.19%).
| Demographics | Rating | Rank | Female Poverty |
| Jamaicans | 0.2 /100 | #256 | Tragic 15.5% |
| Immigrants | Jamaica | 0.1 /100 | #257 | Tragic 15.6% |
| Shoshone | 0.1 /100 | #258 | Tragic 15.6% |
| Cape Verdeans | 0.1 /100 | #259 | Tragic 15.6% |
| Immigrants | Guyana | 0.1 /100 | #260 | Tragic 15.6% |
| Guyanese | 0.1 /100 | #261 | Tragic 15.6% |
| Mexican American Indians | 0.1 /100 | #262 | Tragic 15.6% |
| Cherokee | 0.1 /100 | #263 | Tragic 15.6% |
| Immigrants | Ecuador | 0.1 /100 | #264 | Tragic 15.6% |
| Immigrants | Liberia | 0.1 /100 | #265 | Tragic 15.7% |
| Immigrants | El Salvador | 0.1 /100 | #266 | Tragic 15.7% |
| Sub-Saharan Africans | 0.1 /100 | #267 | Tragic 15.8% |
| Immigrants | Nicaragua | 0.1 /100 | #268 | Tragic 15.8% |
| Iroquois | 0.1 /100 | #269 | Tragic 15.8% |
| Chickasaw | 0.1 /100 | #270 | Tragic 15.9% |
Demographics Similar to Immigrants from Poland by Female Poverty
In terms of female poverty, the demographic groups most similar to Immigrants from Poland are Macedonian (11.8%, a difference of 0.050%), Russian (11.8%, a difference of 0.21%), Immigrants from Greece (11.8%, a difference of 0.22%), Czech (11.9%, a difference of 0.23%), and Immigrants from Moldova (11.9%, a difference of 0.23%).
| Demographics | Rating | Rank | Female Poverty |
| Danes | 99.5 /100 | #32 | Exceptional 11.7% |
| Cypriots | 99.5 /100 | #33 | Exceptional 11.8% |
| Immigrants | Singapore | 99.4 /100 | #34 | Exceptional 11.8% |
| Immigrants | Iran | 99.4 /100 | #35 | Exceptional 11.8% |
| Immigrants | Pakistan | 99.4 /100 | #36 | Exceptional 11.8% |
| Immigrants | Greece | 99.3 /100 | #37 | Exceptional 11.8% |
| Russians | 99.3 /100 | #38 | Exceptional 11.8% |
| Immigrants | Poland | 99.3 /100 | #39 | Exceptional 11.8% |
| Macedonians | 99.3 /100 | #40 | Exceptional 11.8% |
| Czechs | 99.2 /100 | #41 | Exceptional 11.9% |
| Immigrants | Moldova | 99.2 /100 | #42 | Exceptional 11.9% |
| Koreans | 99.2 /100 | #43 | Exceptional 11.9% |
| Tongans | 99.2 /100 | #44 | Exceptional 11.9% |
| Immigrants | Czechoslovakia | 99.2 /100 | #45 | Exceptional 11.9% |
| Turks | 99.2 /100 | #46 | Exceptional 11.9% |