Cherokee vs Iraqi Female Poverty
COMPARE
Cherokee
Iraqi
Female Poverty
Female Poverty Comparison
Cherokee
Iraqis
15.6%
FEMALE POVERTY
0.1/ 100
METRIC RATING
263rd/ 347
METRIC RANK
13.7%
FEMALE POVERTY
31.8/ 100
METRIC RATING
193rd/ 347
METRIC RANK
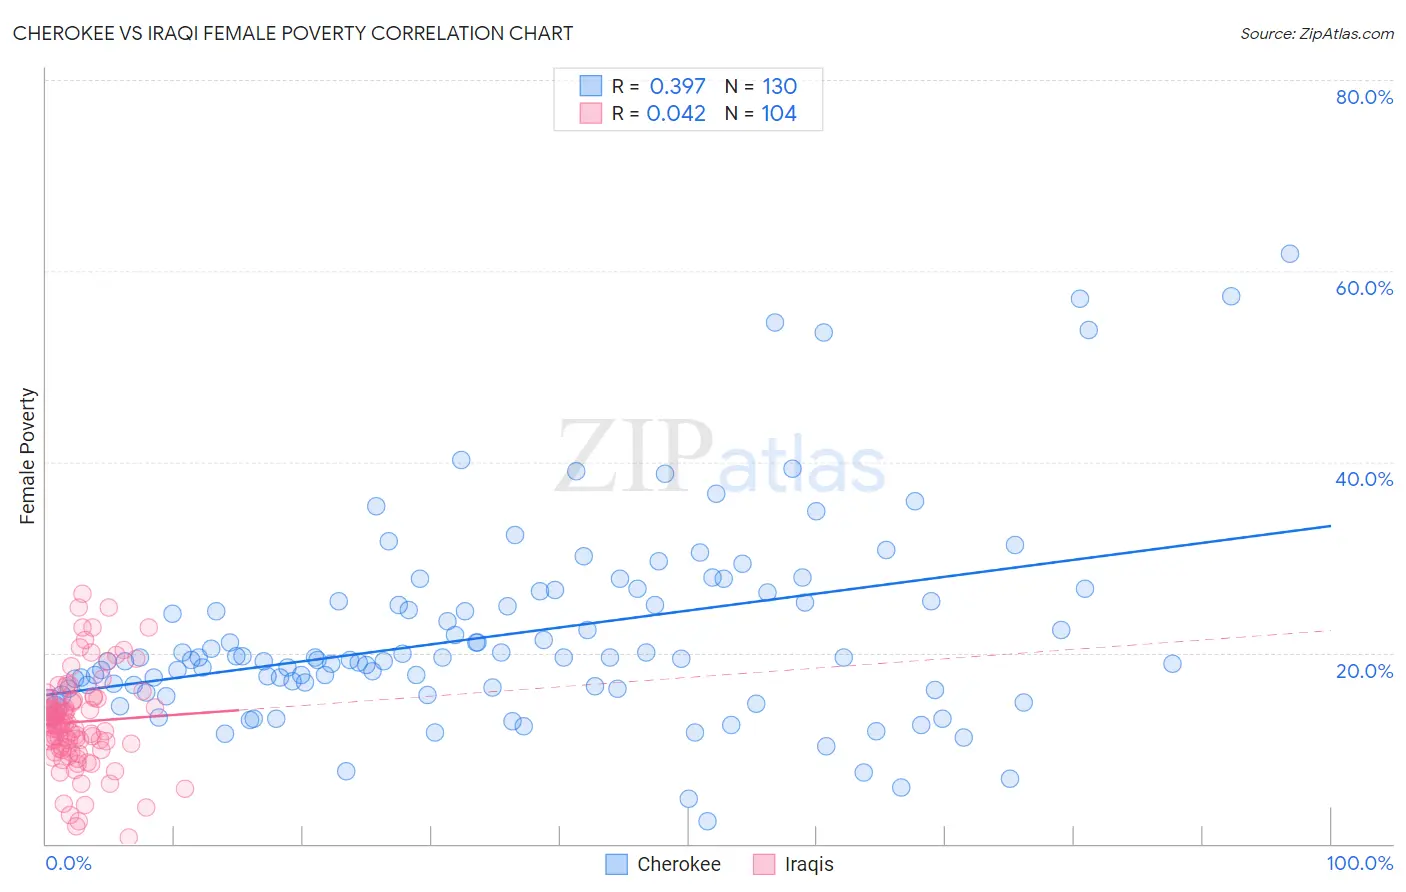
Cherokee vs Iraqi Female Poverty Correlation Chart
The statistical analysis conducted on geographies consisting of 493,220,722 people shows a mild positive correlation between the proportion of Cherokee and poverty level among females in the United States with a correlation coefficient (R) of 0.397 and weighted average of 15.6%. Similarly, the statistical analysis conducted on geographies consisting of 170,556,869 people shows no correlation between the proportion of Iraqis and poverty level among females in the United States with a correlation coefficient (R) of 0.042 and weighted average of 13.7%, a difference of 14.0%.
Female Poverty Correlation Summary
| Measurement | Cherokee | Iraqi |
| Minimum | 2.3% | 0.62% |
| Maximum | 61.8% | 26.1% |
| Range | 59.5% | 25.5% |
| Mean | 21.9% | 12.8% |
| Median | 19.3% | 12.5% |
| Interquartile 25% (IQ1) | 16.3% | 10.0% |
| Interquartile 75% (IQ3) | 25.5% | 15.1% |
| Interquartile Range (IQR) | 9.2% | 5.1% |
| Standard Deviation (Sample) | 10.5% | 4.9% |
| Standard Deviation (Population) | 10.5% | 4.9% |
Similar Demographics by Female Poverty
Demographics Similar to Cherokee by Female Poverty
In terms of female poverty, the demographic groups most similar to Cherokee are Guyanese (15.6%, a difference of 0.010%), Mexican American Indian (15.6%, a difference of 0.010%), Immigrants from Guyana (15.6%, a difference of 0.11%), Immigrants from Ecuador (15.6%, a difference of 0.13%), and Cape Verdean (15.6%, a difference of 0.19%).
| Demographics | Rating | Rank | Female Poverty |
| Jamaicans | 0.2 /100 | #256 | Tragic 15.5% |
| Immigrants | Jamaica | 0.1 /100 | #257 | Tragic 15.6% |
| Shoshone | 0.1 /100 | #258 | Tragic 15.6% |
| Cape Verdeans | 0.1 /100 | #259 | Tragic 15.6% |
| Immigrants | Guyana | 0.1 /100 | #260 | Tragic 15.6% |
| Guyanese | 0.1 /100 | #261 | Tragic 15.6% |
| Mexican American Indians | 0.1 /100 | #262 | Tragic 15.6% |
| Cherokee | 0.1 /100 | #263 | Tragic 15.6% |
| Immigrants | Ecuador | 0.1 /100 | #264 | Tragic 15.6% |
| Immigrants | Liberia | 0.1 /100 | #265 | Tragic 15.7% |
| Immigrants | El Salvador | 0.1 /100 | #266 | Tragic 15.7% |
| Sub-Saharan Africans | 0.1 /100 | #267 | Tragic 15.8% |
| Immigrants | Nicaragua | 0.1 /100 | #268 | Tragic 15.8% |
| Iroquois | 0.1 /100 | #269 | Tragic 15.8% |
| Chickasaw | 0.1 /100 | #270 | Tragic 15.9% |
Demographics Similar to Iraqis by Female Poverty
In terms of female poverty, the demographic groups most similar to Iraqis are Immigrants from Costa Rica (13.7%, a difference of 0.020%), Delaware (13.7%, a difference of 0.070%), Immigrants from Kuwait (13.7%, a difference of 0.10%), Immigrants from South America (13.7%, a difference of 0.12%), and Sierra Leonean (13.7%, a difference of 0.14%).
| Demographics | Rating | Rank | Female Poverty |
| Immigrants | Portugal | 41.5 /100 | #186 | Average 13.6% |
| Immigrants | Venezuela | 41.0 /100 | #187 | Average 13.6% |
| Hawaiians | 39.9 /100 | #188 | Fair 13.6% |
| Uruguayans | 39.8 /100 | #189 | Fair 13.6% |
| Sierra Leoneans | 33.1 /100 | #190 | Fair 13.7% |
| Immigrants | Kuwait | 32.7 /100 | #191 | Fair 13.7% |
| Immigrants | Costa Rica | 31.9 /100 | #192 | Fair 13.7% |
| Iraqis | 31.8 /100 | #193 | Fair 13.7% |
| Delaware | 31.1 /100 | #194 | Fair 13.7% |
| Immigrants | South America | 30.6 /100 | #195 | Fair 13.7% |
| South American Indians | 28.9 /100 | #196 | Fair 13.7% |
| Arabs | 28.6 /100 | #197 | Fair 13.7% |
| Immigrants | Uganda | 28.5 /100 | #198 | Fair 13.7% |
| Immigrants | Lebanon | 25.6 /100 | #199 | Fair 13.8% |
| Spanish | 21.4 /100 | #200 | Fair 13.9% |