Austrian vs Hungarian Female Poverty
COMPARE
Austrian
Hungarian
Female Poverty
Female Poverty Comparison
Austrians
Hungarians
12.2%
FEMALE POVERTY
97.9/ 100
METRIC RATING
66th/ 347
METRIC RANK
13.2%
FEMALE POVERTY
70.1/ 100
METRIC RATING
155th/ 347
METRIC RANK
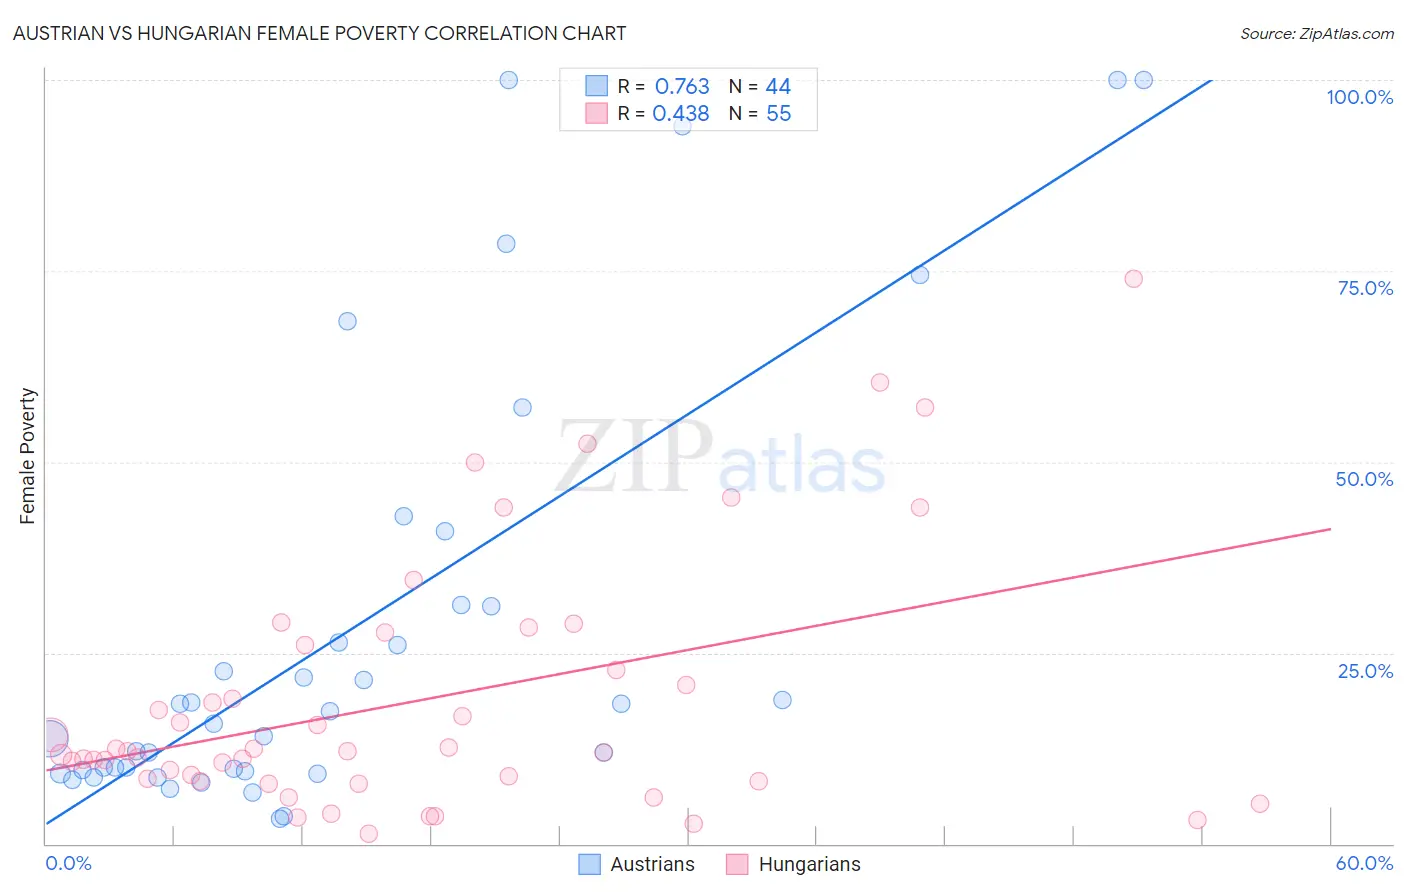
Austrian vs Hungarian Female Poverty Correlation Chart
The statistical analysis conducted on geographies consisting of 451,657,404 people shows a strong positive correlation between the proportion of Austrians and poverty level among females in the United States with a correlation coefficient (R) of 0.763 and weighted average of 12.2%. Similarly, the statistical analysis conducted on geographies consisting of 485,692,155 people shows a moderate positive correlation between the proportion of Hungarians and poverty level among females in the United States with a correlation coefficient (R) of 0.438 and weighted average of 13.2%, a difference of 8.0%.
Female Poverty Correlation Summary
| Measurement | Austrian | Hungarian |
| Minimum | 3.3% | 1.3% |
| Maximum | 100.0% | 73.9% |
| Range | 96.7% | 72.6% |
| Mean | 28.2% | 18.8% |
| Median | 16.5% | 12.1% |
| Interquartile 25% (IQ1) | 9.6% | 8.2% |
| Interquartile 75% (IQ3) | 31.2% | 26.0% |
| Interquartile Range (IQR) | 21.6% | 17.7% |
| Standard Deviation (Sample) | 28.8% | 16.6% |
| Standard Deviation (Population) | 28.5% | 16.5% |
Similar Demographics by Female Poverty
Demographics Similar to Austrians by Female Poverty
In terms of female poverty, the demographic groups most similar to Austrians are Indian (Asian) (12.2%, a difference of 0.010%), German (12.2%, a difference of 0.040%), Ukrainian (12.2%, a difference of 0.070%), Immigrants from Eastern Asia (12.2%, a difference of 0.13%), and Immigrants from Italy (12.2%, a difference of 0.15%).
| Demographics | Rating | Rank | Female Poverty |
| Immigrants | Europe | 98.2 /100 | #59 | Exceptional 12.1% |
| Immigrants | Australia | 98.1 /100 | #60 | Exceptional 12.2% |
| Immigrants | Asia | 98.1 /100 | #61 | Exceptional 12.2% |
| Immigrants | Italy | 98.0 /100 | #62 | Exceptional 12.2% |
| Ukrainians | 98.0 /100 | #63 | Exceptional 12.2% |
| Germans | 98.0 /100 | #64 | Exceptional 12.2% |
| Indians (Asian) | 97.9 /100 | #65 | Exceptional 12.2% |
| Austrians | 97.9 /100 | #66 | Exceptional 12.2% |
| Immigrants | Eastern Asia | 97.8 /100 | #67 | Exceptional 12.2% |
| Immigrants | Netherlands | 97.8 /100 | #68 | Exceptional 12.2% |
| Swiss | 97.7 /100 | #69 | Exceptional 12.2% |
| Immigrants | Belgium | 97.7 /100 | #70 | Exceptional 12.2% |
| Carpatho Rusyns | 97.6 /100 | #71 | Exceptional 12.2% |
| Cambodians | 97.5 /100 | #72 | Exceptional 12.2% |
| Zimbabweans | 97.5 /100 | #73 | Exceptional 12.3% |
Demographics Similar to Hungarians by Female Poverty
In terms of female poverty, the demographic groups most similar to Hungarians are Armenian (13.2%, a difference of 0.040%), Immigrants from Bosnia and Herzegovina (13.2%, a difference of 0.050%), Immigrants from Fiji (13.2%, a difference of 0.10%), Immigrants from Northern Africa (13.2%, a difference of 0.15%), and Pennsylvania German (13.2%, a difference of 0.32%).
| Demographics | Rating | Rank | Female Poverty |
| Yugoslavians | 76.9 /100 | #148 | Good 13.1% |
| Taiwanese | 75.7 /100 | #149 | Good 13.1% |
| Tsimshian | 75.5 /100 | #150 | Good 13.1% |
| Immigrants | Germany | 74.9 /100 | #151 | Good 13.1% |
| Samoans | 73.6 /100 | #152 | Good 13.1% |
| Immigrants | Fiji | 71.0 /100 | #153 | Good 13.2% |
| Armenians | 70.4 /100 | #154 | Good 13.2% |
| Hungarians | 70.1 /100 | #155 | Good 13.2% |
| Immigrants | Bosnia and Herzegovina | 69.7 /100 | #156 | Good 13.2% |
| Immigrants | Northern Africa | 68.8 /100 | #157 | Good 13.2% |
| Pennsylvania Germans | 67.3 /100 | #158 | Good 13.2% |
| Costa Ricans | 63.6 /100 | #159 | Good 13.3% |
| Immigrants | Nepal | 62.7 /100 | #160 | Good 13.3% |
| Immigrants | Ethiopia | 62.5 /100 | #161 | Good 13.3% |
| Guamanians/Chamorros | 62.4 /100 | #162 | Good 13.3% |