Cherokee vs Dutch West Indian Female Poverty
COMPARE
Cherokee
Dutch West Indian
Female Poverty
Female Poverty Comparison
Cherokee
Dutch West Indians
15.6%
FEMALE POVERTY
0.1/ 100
METRIC RATING
263rd/ 347
METRIC RANK
17.1%
FEMALE POVERTY
0.0/ 100
METRIC RATING
314th/ 347
METRIC RANK
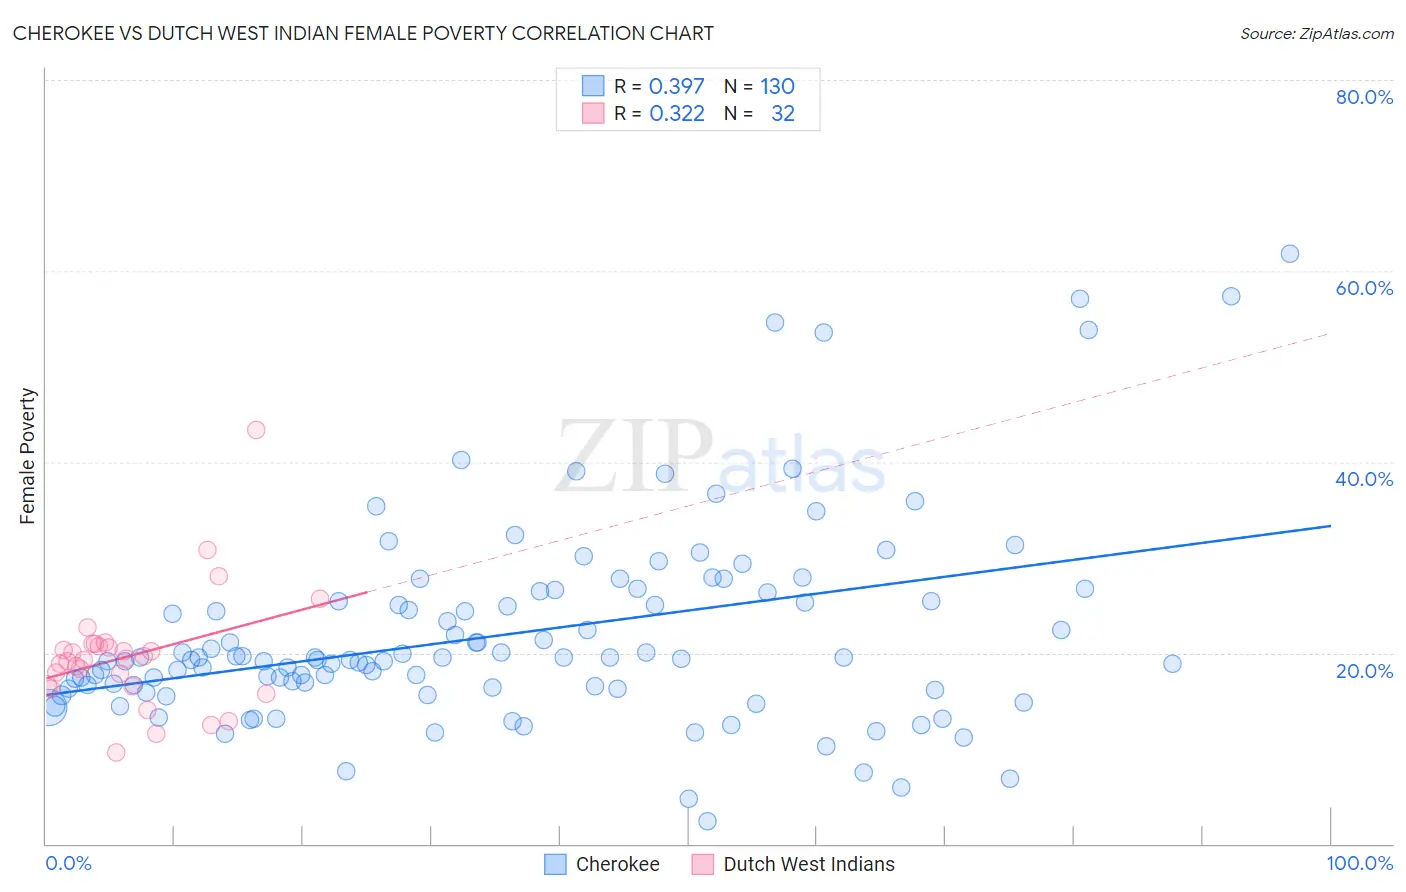
Cherokee vs Dutch West Indian Female Poverty Correlation Chart
The statistical analysis conducted on geographies consisting of 493,220,722 people shows a mild positive correlation between the proportion of Cherokee and poverty level among females in the United States with a correlation coefficient (R) of 0.397 and weighted average of 15.6%. Similarly, the statistical analysis conducted on geographies consisting of 85,761,145 people shows a mild positive correlation between the proportion of Dutch West Indians and poverty level among females in the United States with a correlation coefficient (R) of 0.322 and weighted average of 17.1%, a difference of 9.4%.
Female Poverty Correlation Summary
| Measurement | Cherokee | Dutch West Indian |
| Minimum | 2.3% | 9.6% |
| Maximum | 61.8% | 43.3% |
| Range | 59.5% | 33.7% |
| Mean | 21.9% | 19.7% |
| Median | 19.3% | 19.3% |
| Interquartile 25% (IQ1) | 16.3% | 16.5% |
| Interquartile 75% (IQ3) | 25.5% | 20.8% |
| Interquartile Range (IQR) | 9.2% | 4.3% |
| Standard Deviation (Sample) | 10.5% | 6.1% |
| Standard Deviation (Population) | 10.5% | 6.0% |
Similar Demographics by Female Poverty
Demographics Similar to Cherokee by Female Poverty
In terms of female poverty, the demographic groups most similar to Cherokee are Guyanese (15.6%, a difference of 0.010%), Mexican American Indian (15.6%, a difference of 0.010%), Immigrants from Guyana (15.6%, a difference of 0.11%), Immigrants from Ecuador (15.6%, a difference of 0.13%), and Cape Verdean (15.6%, a difference of 0.19%).
| Demographics | Rating | Rank | Female Poverty |
| Jamaicans | 0.2 /100 | #256 | Tragic 15.5% |
| Immigrants | Jamaica | 0.1 /100 | #257 | Tragic 15.6% |
| Shoshone | 0.1 /100 | #258 | Tragic 15.6% |
| Cape Verdeans | 0.1 /100 | #259 | Tragic 15.6% |
| Immigrants | Guyana | 0.1 /100 | #260 | Tragic 15.6% |
| Guyanese | 0.1 /100 | #261 | Tragic 15.6% |
| Mexican American Indians | 0.1 /100 | #262 | Tragic 15.6% |
| Cherokee | 0.1 /100 | #263 | Tragic 15.6% |
| Immigrants | Ecuador | 0.1 /100 | #264 | Tragic 15.6% |
| Immigrants | Liberia | 0.1 /100 | #265 | Tragic 15.7% |
| Immigrants | El Salvador | 0.1 /100 | #266 | Tragic 15.7% |
| Sub-Saharan Africans | 0.1 /100 | #267 | Tragic 15.8% |
| Immigrants | Nicaragua | 0.1 /100 | #268 | Tragic 15.8% |
| Iroquois | 0.1 /100 | #269 | Tragic 15.8% |
| Chickasaw | 0.1 /100 | #270 | Tragic 15.9% |
Demographics Similar to Dutch West Indians by Female Poverty
In terms of female poverty, the demographic groups most similar to Dutch West Indians are British West Indian (17.0%, a difference of 0.25%), Immigrants from Somalia (17.0%, a difference of 0.33%), Creek (17.0%, a difference of 0.42%), Immigrants from Guatemala (17.0%, a difference of 0.42%), and Immigrants from Mexico (17.0%, a difference of 0.67%).
| Demographics | Rating | Rank | Female Poverty |
| Seminole | 0.0 /100 | #307 | Tragic 16.9% |
| Africans | 0.0 /100 | #308 | Tragic 16.9% |
| Immigrants | Mexico | 0.0 /100 | #309 | Tragic 17.0% |
| Creek | 0.0 /100 | #310 | Tragic 17.0% |
| Immigrants | Guatemala | 0.0 /100 | #311 | Tragic 17.0% |
| Immigrants | Somalia | 0.0 /100 | #312 | Tragic 17.0% |
| British West Indians | 0.0 /100 | #313 | Tragic 17.0% |
| Dutch West Indians | 0.0 /100 | #314 | Tragic 17.1% |
| U.S. Virgin Islanders | 0.0 /100 | #315 | Tragic 17.3% |
| Hondurans | 0.0 /100 | #316 | Tragic 17.4% |
| Immigrants | Congo | 0.0 /100 | #317 | Tragic 17.4% |
| Ute | 0.0 /100 | #318 | Tragic 17.5% |
| Cajuns | 0.0 /100 | #319 | Tragic 17.5% |
| Immigrants | Dominica | 0.0 /100 | #320 | Tragic 17.5% |
| Arapaho | 0.0 /100 | #321 | Tragic 17.5% |