Cherokee vs Immigrants from Zimbabwe Female Poverty
COMPARE
Cherokee
Immigrants from Zimbabwe
Female Poverty
Female Poverty Comparison
Cherokee
Immigrants from Zimbabwe
15.6%
FEMALE POVERTY
0.1/ 100
METRIC RATING
263rd/ 347
METRIC RANK
12.6%
FEMALE POVERTY
93.1/ 100
METRIC RATING
109th/ 347
METRIC RANK
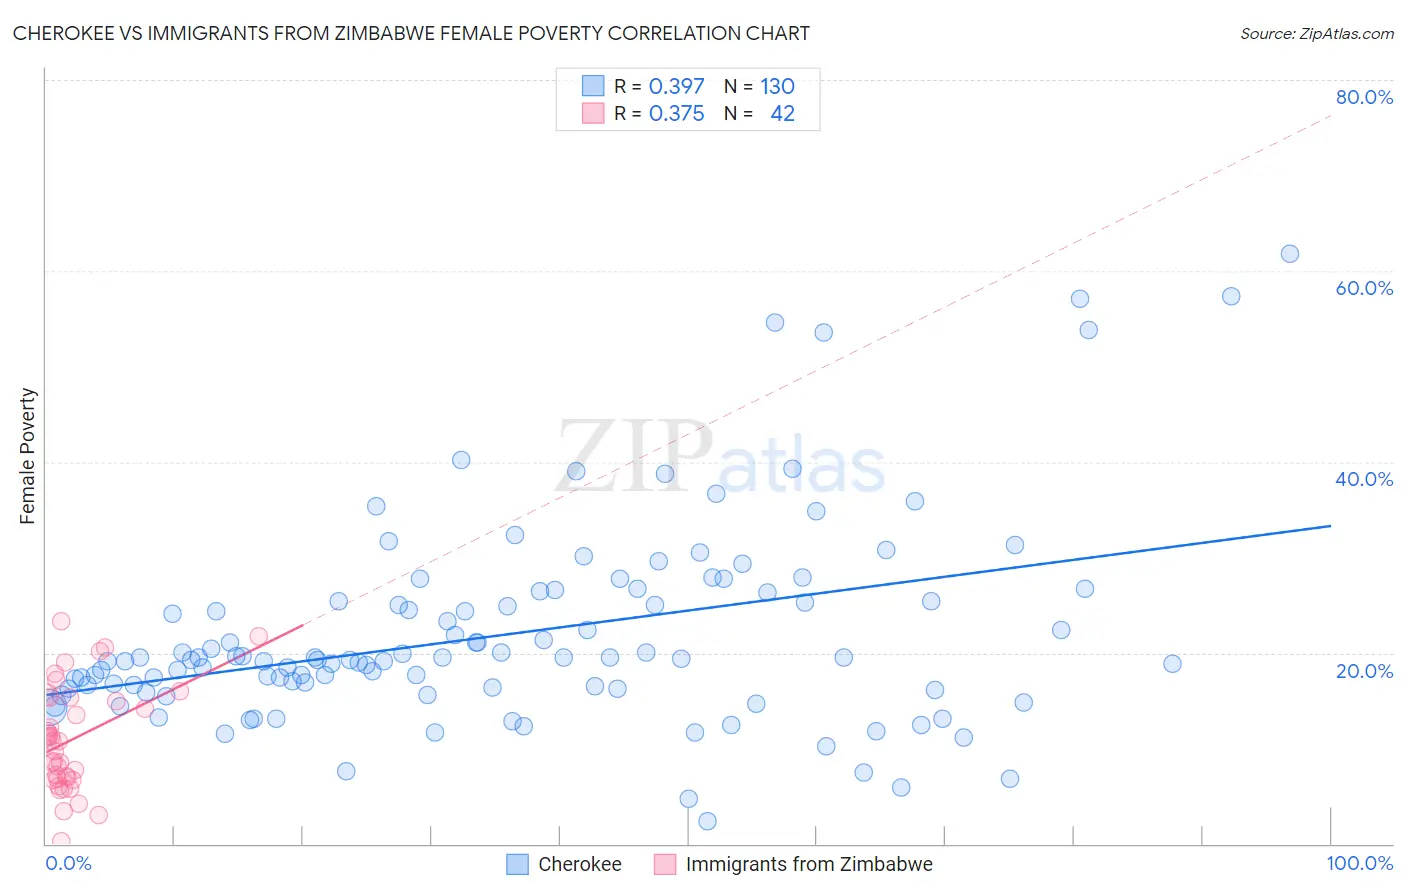
Cherokee vs Immigrants from Zimbabwe Female Poverty Correlation Chart
The statistical analysis conducted on geographies consisting of 493,220,722 people shows a mild positive correlation between the proportion of Cherokee and poverty level among females in the United States with a correlation coefficient (R) of 0.397 and weighted average of 15.6%. Similarly, the statistical analysis conducted on geographies consisting of 117,784,385 people shows a mild positive correlation between the proportion of Immigrants from Zimbabwe and poverty level among females in the United States with a correlation coefficient (R) of 0.375 and weighted average of 12.6%, a difference of 23.9%.
Female Poverty Correlation Summary
| Measurement | Cherokee | Immigrants from Zimbabwe |
| Minimum | 2.3% | 0.23% |
| Maximum | 61.8% | 23.3% |
| Range | 59.5% | 23.1% |
| Mean | 21.9% | 11.0% |
| Median | 19.3% | 10.8% |
| Interquartile 25% (IQ1) | 16.3% | 6.7% |
| Interquartile 75% (IQ3) | 25.5% | 15.3% |
| Interquartile Range (IQR) | 9.2% | 8.6% |
| Standard Deviation (Sample) | 10.5% | 5.5% |
| Standard Deviation (Population) | 10.5% | 5.4% |
Similar Demographics by Female Poverty
Demographics Similar to Cherokee by Female Poverty
In terms of female poverty, the demographic groups most similar to Cherokee are Guyanese (15.6%, a difference of 0.010%), Mexican American Indian (15.6%, a difference of 0.010%), Immigrants from Guyana (15.6%, a difference of 0.11%), Immigrants from Ecuador (15.6%, a difference of 0.13%), and Cape Verdean (15.6%, a difference of 0.19%).
| Demographics | Rating | Rank | Female Poverty |
| Jamaicans | 0.2 /100 | #256 | Tragic 15.5% |
| Immigrants | Jamaica | 0.1 /100 | #257 | Tragic 15.6% |
| Shoshone | 0.1 /100 | #258 | Tragic 15.6% |
| Cape Verdeans | 0.1 /100 | #259 | Tragic 15.6% |
| Immigrants | Guyana | 0.1 /100 | #260 | Tragic 15.6% |
| Guyanese | 0.1 /100 | #261 | Tragic 15.6% |
| Mexican American Indians | 0.1 /100 | #262 | Tragic 15.6% |
| Cherokee | 0.1 /100 | #263 | Tragic 15.6% |
| Immigrants | Ecuador | 0.1 /100 | #264 | Tragic 15.6% |
| Immigrants | Liberia | 0.1 /100 | #265 | Tragic 15.7% |
| Immigrants | El Salvador | 0.1 /100 | #266 | Tragic 15.7% |
| Sub-Saharan Africans | 0.1 /100 | #267 | Tragic 15.8% |
| Immigrants | Nicaragua | 0.1 /100 | #268 | Tragic 15.8% |
| Iroquois | 0.1 /100 | #269 | Tragic 15.8% |
| Chickasaw | 0.1 /100 | #270 | Tragic 15.9% |
Demographics Similar to Immigrants from Zimbabwe by Female Poverty
In terms of female poverty, the demographic groups most similar to Immigrants from Zimbabwe are Portuguese (12.6%, a difference of 0.020%), Paraguayan (12.6%, a difference of 0.030%), Laotian (12.6%, a difference of 0.12%), Soviet Union (12.6%, a difference of 0.25%), and Immigrants from Turkey (12.6%, a difference of 0.31%).
| Demographics | Rating | Rank | Female Poverty |
| Immigrants | China | 94.5 /100 | #102 | Exceptional 12.5% |
| Slavs | 94.5 /100 | #103 | Exceptional 12.5% |
| Palestinians | 94.3 /100 | #104 | Exceptional 12.5% |
| Scottish | 94.1 /100 | #105 | Exceptional 12.5% |
| Immigrants | Turkey | 93.8 /100 | #106 | Exceptional 12.6% |
| Laotians | 93.4 /100 | #107 | Exceptional 12.6% |
| Portuguese | 93.1 /100 | #108 | Exceptional 12.6% |
| Immigrants | Zimbabwe | 93.1 /100 | #109 | Exceptional 12.6% |
| Paraguayans | 93.0 /100 | #110 | Exceptional 12.6% |
| Soviet Union | 92.4 /100 | #111 | Exceptional 12.6% |
| Immigrants | Israel | 92.0 /100 | #112 | Exceptional 12.6% |
| Canadians | 92.0 /100 | #113 | Exceptional 12.7% |
| Welsh | 91.6 /100 | #114 | Exceptional 12.7% |
| Puget Sound Salish | 91.5 /100 | #115 | Exceptional 12.7% |
| Immigrants | Russia | 91.2 /100 | #116 | Exceptional 12.7% |